Luxembourger vs Lumbee Median Earnings
COMPARE
Luxembourger
Lumbee
Median Earnings
Median Earnings Comparison
Luxembourgers
Lumbee
$47,640
MEDIAN EARNINGS
84.5/ 100
METRIC RATING
149th/ 347
METRIC RANK
$36,876
MEDIAN EARNINGS
0.0/ 100
METRIC RATING
341st/ 347
METRIC RANK
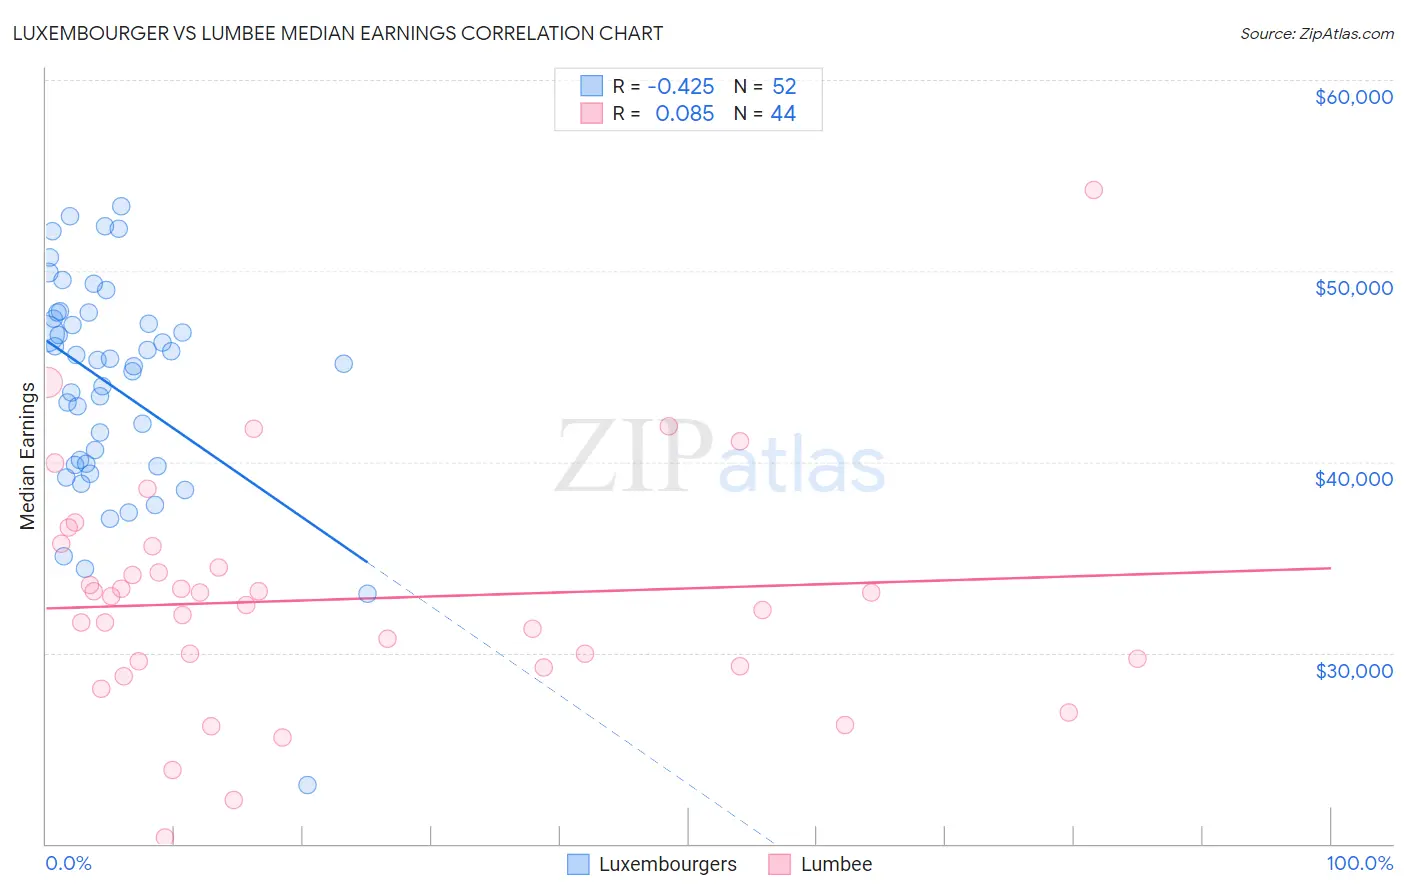
Luxembourger vs Lumbee Median Earnings Correlation Chart
The statistical analysis conducted on geographies consisting of 144,679,059 people shows a moderate negative correlation between the proportion of Luxembourgers and median earnings in the United States with a correlation coefficient (R) of -0.425 and weighted average of $47,640. Similarly, the statistical analysis conducted on geographies consisting of 92,282,036 people shows a slight positive correlation between the proportion of Lumbee and median earnings in the United States with a correlation coefficient (R) of 0.085 and weighted average of $36,876, a difference of 29.2%.
Median Earnings Correlation Summary
| Measurement | Luxembourger | Lumbee |
| Minimum | $23,065 | $20,337 |
| Maximum | $53,418 | $54,265 |
| Range | $30,353 | $33,928 |
| Mean | $43,977 | $32,791 |
| Median | $45,242 | $32,724 |
| Interquartile 25% (IQ1) | $39,899 | $29,449 |
| Interquartile 75% (IQ3) | $47,654 | $35,034 |
| Interquartile Range (IQR) | $7,755 | $5,585 |
| Standard Deviation (Sample) | $5,791 | $6,085 |
| Standard Deviation (Population) | $5,735 | $6,015 |
Similar Demographics by Median Earnings
Demographics Similar to Luxembourgers by Median Earnings
In terms of median earnings, the demographic groups most similar to Luxembourgers are Peruvian ($47,628, a difference of 0.020%), Immigrants from Eritrea ($47,657, a difference of 0.040%), Immigrants from Oceania ($47,617, a difference of 0.050%), Immigrants from South Eastern Asia ($47,671, a difference of 0.060%), and Immigrants from Chile ($47,697, a difference of 0.12%).
| Demographics | Rating | Rank | Median Earnings |
| Ugandans | 88.0 /100 | #142 | Excellent $47,854 |
| Swedes | 88.0 /100 | #143 | Excellent $47,851 |
| Hungarians | 87.1 /100 | #144 | Excellent $47,795 |
| Immigrants | Saudi Arabia | 85.6 /100 | #145 | Excellent $47,704 |
| Immigrants | Chile | 85.5 /100 | #146 | Excellent $47,697 |
| Immigrants | South Eastern Asia | 85.0 /100 | #147 | Excellent $47,671 |
| Immigrants | Eritrea | 84.8 /100 | #148 | Excellent $47,657 |
| Luxembourgers | 84.5 /100 | #149 | Excellent $47,640 |
| Peruvians | 84.2 /100 | #150 | Excellent $47,628 |
| Immigrants | Oceania | 84.1 /100 | #151 | Excellent $47,617 |
| Immigrants | Germany | 83.1 /100 | #152 | Excellent $47,566 |
| Slavs | 81.1 /100 | #153 | Excellent $47,470 |
| Immigrants | Portugal | 77.3 /100 | #154 | Good $47,304 |
| Immigrants | Vietnam | 76.7 /100 | #155 | Good $47,282 |
| Irish | 76.6 /100 | #156 | Good $47,276 |
Demographics Similar to Lumbee by Median Earnings
In terms of median earnings, the demographic groups most similar to Lumbee are Hopi ($36,871, a difference of 0.010%), Pueblo ($36,859, a difference of 0.050%), Navajo ($36,999, a difference of 0.33%), Arapaho ($36,586, a difference of 0.79%), and Tohono O'odham ($36,349, a difference of 1.5%).
| Demographics | Rating | Rank | Median Earnings |
| Houma | 0.0 /100 | #333 | Tragic $38,949 |
| Spanish American Indians | 0.0 /100 | #334 | Tragic $38,907 |
| Natives/Alaskans | 0.0 /100 | #335 | Tragic $38,896 |
| Crow | 0.0 /100 | #336 | Tragic $38,707 |
| Immigrants | Cuba | 0.0 /100 | #337 | Tragic $38,426 |
| Pima | 0.0 /100 | #338 | Tragic $38,285 |
| Menominee | 0.0 /100 | #339 | Tragic $37,884 |
| Navajo | 0.0 /100 | #340 | Tragic $36,999 |
| Lumbee | 0.0 /100 | #341 | Tragic $36,876 |
| Hopi | 0.0 /100 | #342 | Tragic $36,871 |
| Pueblo | 0.0 /100 | #343 | Tragic $36,859 |
| Arapaho | 0.0 /100 | #344 | Tragic $36,586 |
| Tohono O'odham | 0.0 /100 | #345 | Tragic $36,349 |
| Yup'ik | 0.0 /100 | #346 | Tragic $35,942 |
| Puerto Ricans | 0.0 /100 | #347 | Tragic $35,560 |