Luxembourger vs Latvian Median Earnings
COMPARE
Luxembourger
Latvian
Median Earnings
Median Earnings Comparison
Luxembourgers
Latvians
$47,640
MEDIAN EARNINGS
84.5/ 100
METRIC RATING
149th/ 347
METRIC RANK
$53,001
MEDIAN EARNINGS
100.0/ 100
METRIC RATING
38th/ 347
METRIC RANK
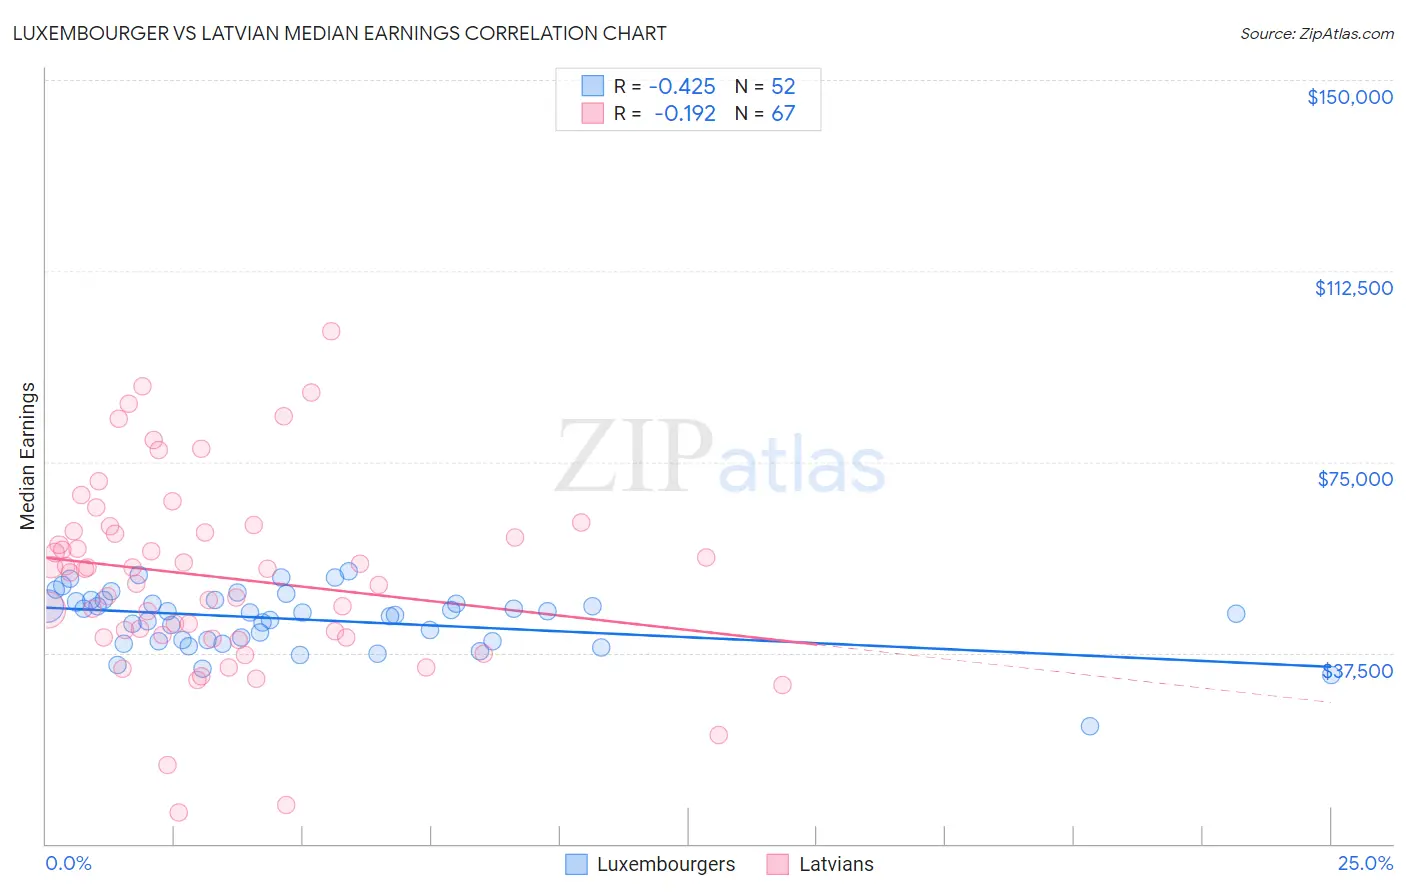
Luxembourger vs Latvian Median Earnings Correlation Chart
The statistical analysis conducted on geographies consisting of 144,679,059 people shows a moderate negative correlation between the proportion of Luxembourgers and median earnings in the United States with a correlation coefficient (R) of -0.425 and weighted average of $47,640. Similarly, the statistical analysis conducted on geographies consisting of 220,722,204 people shows a poor negative correlation between the proportion of Latvians and median earnings in the United States with a correlation coefficient (R) of -0.192 and weighted average of $53,001, a difference of 11.3%.
Median Earnings Correlation Summary
| Measurement | Luxembourger | Latvian |
| Minimum | $23,065 | $6,196 |
| Maximum | $53,418 | $100,625 |
| Range | $30,353 | $94,429 |
| Mean | $43,977 | $52,387 |
| Median | $45,242 | $53,984 |
| Interquartile 25% (IQ1) | $39,899 | $40,578 |
| Interquartile 75% (IQ3) | $47,654 | $61,313 |
| Interquartile Range (IQR) | $7,755 | $20,735 |
| Standard Deviation (Sample) | $5,791 | $18,625 |
| Standard Deviation (Population) | $5,735 | $18,485 |
Similar Demographics by Median Earnings
Demographics Similar to Luxembourgers by Median Earnings
In terms of median earnings, the demographic groups most similar to Luxembourgers are Peruvian ($47,628, a difference of 0.020%), Immigrants from Eritrea ($47,657, a difference of 0.040%), Immigrants from Oceania ($47,617, a difference of 0.050%), Immigrants from South Eastern Asia ($47,671, a difference of 0.060%), and Immigrants from Chile ($47,697, a difference of 0.12%).
| Demographics | Rating | Rank | Median Earnings |
| Ugandans | 88.0 /100 | #142 | Excellent $47,854 |
| Swedes | 88.0 /100 | #143 | Excellent $47,851 |
| Hungarians | 87.1 /100 | #144 | Excellent $47,795 |
| Immigrants | Saudi Arabia | 85.6 /100 | #145 | Excellent $47,704 |
| Immigrants | Chile | 85.5 /100 | #146 | Excellent $47,697 |
| Immigrants | South Eastern Asia | 85.0 /100 | #147 | Excellent $47,671 |
| Immigrants | Eritrea | 84.8 /100 | #148 | Excellent $47,657 |
| Luxembourgers | 84.5 /100 | #149 | Excellent $47,640 |
| Peruvians | 84.2 /100 | #150 | Excellent $47,628 |
| Immigrants | Oceania | 84.1 /100 | #151 | Excellent $47,617 |
| Immigrants | Germany | 83.1 /100 | #152 | Excellent $47,566 |
| Slavs | 81.1 /100 | #153 | Excellent $47,470 |
| Immigrants | Portugal | 77.3 /100 | #154 | Good $47,304 |
| Immigrants | Vietnam | 76.7 /100 | #155 | Good $47,282 |
| Irish | 76.6 /100 | #156 | Good $47,276 |
Demographics Similar to Latvians by Median Earnings
In terms of median earnings, the demographic groups most similar to Latvians are Immigrants from Belarus ($53,043, a difference of 0.080%), Immigrants from Turkey ($52,960, a difference of 0.080%), Israeli ($52,937, a difference of 0.12%), Immigrants from Denmark ($53,186, a difference of 0.35%), and Immigrants from Switzerland ($53,211, a difference of 0.40%).
| Demographics | Rating | Rank | Median Earnings |
| Russians | 100.0 /100 | #31 | Exceptional $53,334 |
| Immigrants | Asia | 100.0 /100 | #32 | Exceptional $53,310 |
| Immigrants | Greece | 100.0 /100 | #33 | Exceptional $53,282 |
| Immigrants | Sri Lanka | 100.0 /100 | #34 | Exceptional $53,268 |
| Immigrants | Switzerland | 100.0 /100 | #35 | Exceptional $53,211 |
| Immigrants | Denmark | 100.0 /100 | #36 | Exceptional $53,186 |
| Immigrants | Belarus | 100.0 /100 | #37 | Exceptional $53,043 |
| Latvians | 100.0 /100 | #38 | Exceptional $53,001 |
| Immigrants | Turkey | 100.0 /100 | #39 | Exceptional $52,960 |
| Israelis | 100.0 /100 | #40 | Exceptional $52,937 |
| Immigrants | Lithuania | 100.0 /100 | #41 | Exceptional $52,769 |
| Maltese | 100.0 /100 | #42 | Exceptional $52,526 |
| Immigrants | Malaysia | 100.0 /100 | #43 | Exceptional $52,514 |
| Bulgarians | 100.0 /100 | #44 | Exceptional $52,512 |
| Immigrants | Czechoslovakia | 100.0 /100 | #45 | Exceptional $52,361 |