Immigrants from North America vs Lumbee Median Earnings
COMPARE
Immigrants from North America
Lumbee
Median Earnings
Median Earnings Comparison
Immigrants from North America
Lumbee
$50,108
MEDIAN EARNINGS
99.4/ 100
METRIC RATING
89th/ 347
METRIC RANK
$36,876
MEDIAN EARNINGS
0.0/ 100
METRIC RATING
341st/ 347
METRIC RANK
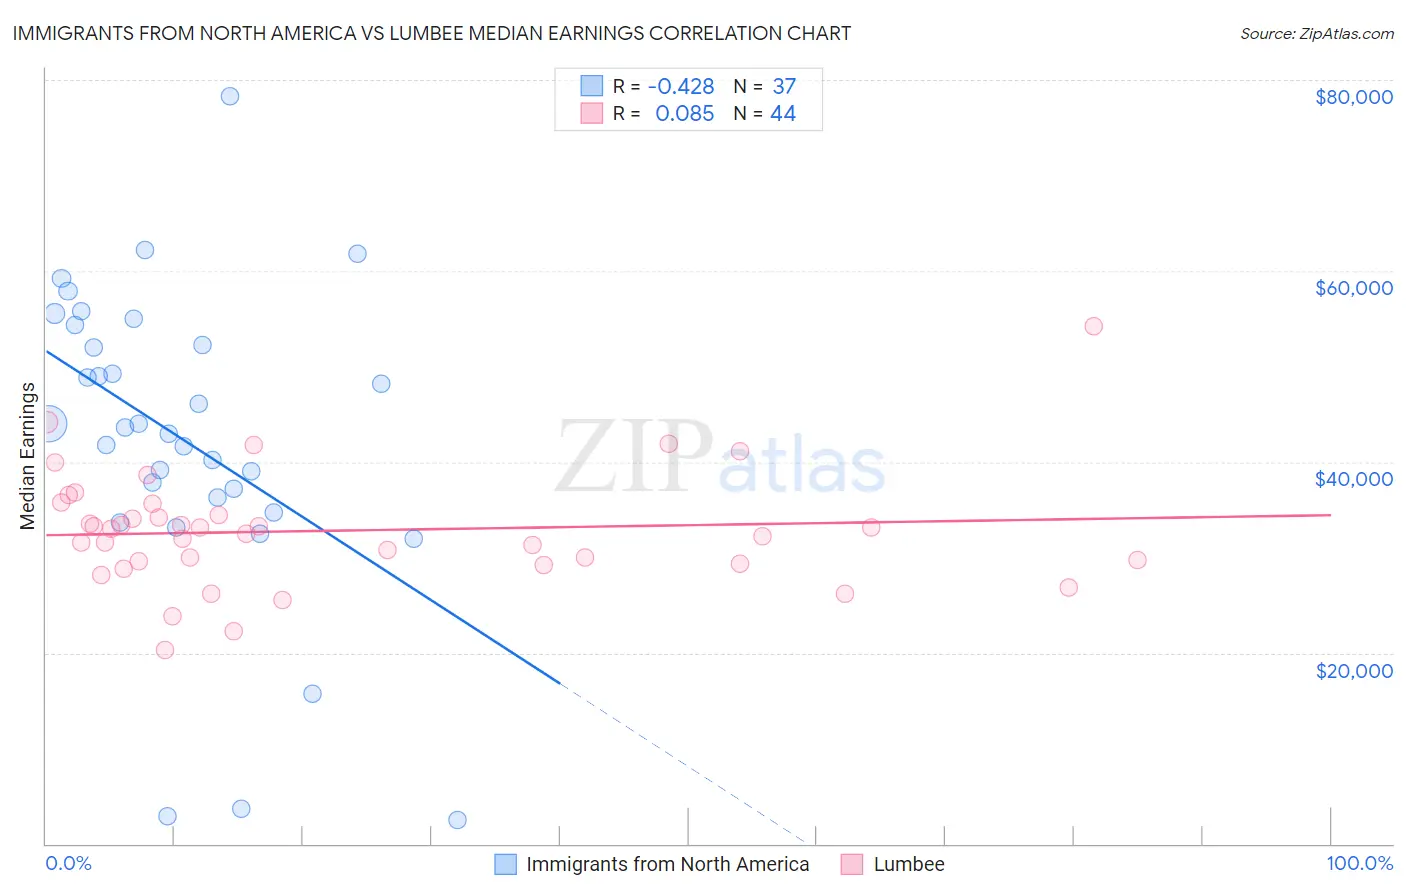
Immigrants from North America vs Lumbee Median Earnings Correlation Chart
The statistical analysis conducted on geographies consisting of 462,391,423 people shows a moderate negative correlation between the proportion of Immigrants from North America and median earnings in the United States with a correlation coefficient (R) of -0.428 and weighted average of $50,108. Similarly, the statistical analysis conducted on geographies consisting of 92,282,036 people shows a slight positive correlation between the proportion of Lumbee and median earnings in the United States with a correlation coefficient (R) of 0.085 and weighted average of $36,876, a difference of 35.9%.
Median Earnings Correlation Summary
| Measurement | Immigrants from North America | Lumbee |
| Minimum | $2,499 | $20,337 |
| Maximum | $78,310 | $54,265 |
| Range | $75,811 | $33,928 |
| Mean | $42,268 | $32,791 |
| Median | $43,536 | $32,724 |
| Interquartile 25% (IQ1) | $35,442 | $29,449 |
| Interquartile 75% (IQ3) | $53,269 | $35,034 |
| Interquartile Range (IQR) | $17,827 | $5,585 |
| Standard Deviation (Sample) | $16,254 | $6,085 |
| Standard Deviation (Population) | $16,033 | $6,015 |
Similar Demographics by Median Earnings
Demographics Similar to Immigrants from North America by Median Earnings
In terms of median earnings, the demographic groups most similar to Immigrants from North America are Albanian ($50,116, a difference of 0.020%), Immigrants from Uzbekistan ($50,151, a difference of 0.090%), Immigrants from Canada ($50,192, a difference of 0.17%), Immigrants from Kazakhstan ($50,225, a difference of 0.23%), and Immigrants from Hungary ($50,227, a difference of 0.24%).
| Demographics | Rating | Rank | Median Earnings |
| Immigrants | Moldova | 99.5 /100 | #82 | Exceptional $50,274 |
| Romanians | 99.5 /100 | #83 | Exceptional $50,244 |
| Immigrants | Hungary | 99.5 /100 | #84 | Exceptional $50,227 |
| Immigrants | Kazakhstan | 99.5 /100 | #85 | Exceptional $50,225 |
| Immigrants | Canada | 99.5 /100 | #86 | Exceptional $50,192 |
| Immigrants | Uzbekistan | 99.5 /100 | #87 | Exceptional $50,151 |
| Albanians | 99.4 /100 | #88 | Exceptional $50,116 |
| Immigrants | North America | 99.4 /100 | #89 | Exceptional $50,108 |
| Italians | 99.3 /100 | #90 | Exceptional $49,915 |
| Macedonians | 99.2 /100 | #91 | Exceptional $49,893 |
| Immigrants | Argentina | 99.2 /100 | #92 | Exceptional $49,841 |
| Armenians | 99.1 /100 | #93 | Exceptional $49,804 |
| Croatians | 99.0 /100 | #94 | Exceptional $49,724 |
| Immigrants | England | 99.0 /100 | #95 | Exceptional $49,722 |
| Immigrants | Lebanon | 99.0 /100 | #96 | Exceptional $49,682 |
Demographics Similar to Lumbee by Median Earnings
In terms of median earnings, the demographic groups most similar to Lumbee are Hopi ($36,871, a difference of 0.010%), Pueblo ($36,859, a difference of 0.050%), Navajo ($36,999, a difference of 0.33%), Arapaho ($36,586, a difference of 0.79%), and Tohono O'odham ($36,349, a difference of 1.5%).
| Demographics | Rating | Rank | Median Earnings |
| Houma | 0.0 /100 | #333 | Tragic $38,949 |
| Spanish American Indians | 0.0 /100 | #334 | Tragic $38,907 |
| Natives/Alaskans | 0.0 /100 | #335 | Tragic $38,896 |
| Crow | 0.0 /100 | #336 | Tragic $38,707 |
| Immigrants | Cuba | 0.0 /100 | #337 | Tragic $38,426 |
| Pima | 0.0 /100 | #338 | Tragic $38,285 |
| Menominee | 0.0 /100 | #339 | Tragic $37,884 |
| Navajo | 0.0 /100 | #340 | Tragic $36,999 |
| Lumbee | 0.0 /100 | #341 | Tragic $36,876 |
| Hopi | 0.0 /100 | #342 | Tragic $36,871 |
| Pueblo | 0.0 /100 | #343 | Tragic $36,859 |
| Arapaho | 0.0 /100 | #344 | Tragic $36,586 |
| Tohono O'odham | 0.0 /100 | #345 | Tragic $36,349 |
| Yup'ik | 0.0 /100 | #346 | Tragic $35,942 |
| Puerto Ricans | 0.0 /100 | #347 | Tragic $35,560 |