Hungarian vs Lumbee Median Earnings
COMPARE
Hungarian
Lumbee
Median Earnings
Median Earnings Comparison
Hungarians
Lumbee
$47,795
MEDIAN EARNINGS
87.1/ 100
METRIC RATING
144th/ 347
METRIC RANK
$36,876
MEDIAN EARNINGS
0.0/ 100
METRIC RATING
341st/ 347
METRIC RANK
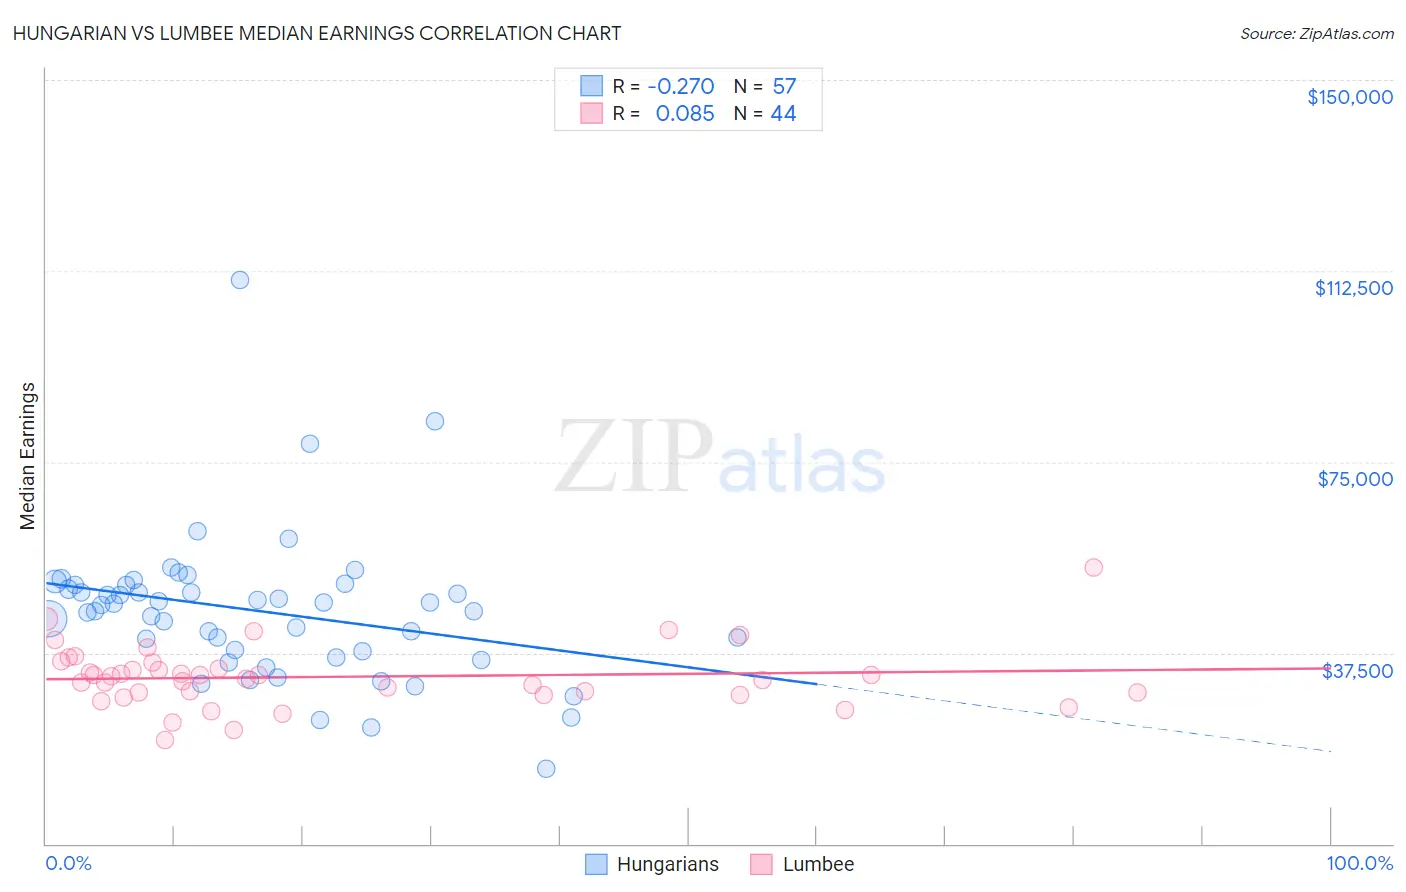
Hungarian vs Lumbee Median Earnings Correlation Chart
The statistical analysis conducted on geographies consisting of 486,158,969 people shows a weak negative correlation between the proportion of Hungarians and median earnings in the United States with a correlation coefficient (R) of -0.270 and weighted average of $47,795. Similarly, the statistical analysis conducted on geographies consisting of 92,282,036 people shows a slight positive correlation between the proportion of Lumbee and median earnings in the United States with a correlation coefficient (R) of 0.085 and weighted average of $36,876, a difference of 29.6%.
Median Earnings Correlation Summary
| Measurement | Hungarian | Lumbee |
| Minimum | $14,721 | $20,337 |
| Maximum | $110,790 | $54,265 |
| Range | $96,069 | $33,928 |
| Mean | $45,677 | $32,791 |
| Median | $46,823 | $32,724 |
| Interquartile 25% (IQ1) | $37,180 | $29,449 |
| Interquartile 75% (IQ3) | $50,813 | $35,034 |
| Interquartile Range (IQR) | $13,633 | $5,585 |
| Standard Deviation (Sample) | $14,634 | $6,085 |
| Standard Deviation (Population) | $14,505 | $6,015 |
Similar Demographics by Median Earnings
Demographics Similar to Hungarians by Median Earnings
In terms of median earnings, the demographic groups most similar to Hungarians are Ugandan ($47,854, a difference of 0.12%), Swedish ($47,851, a difference of 0.12%), Immigrants from Sierra Leone ($47,875, a difference of 0.17%), Immigrants from Saudi Arabia ($47,704, a difference of 0.19%), and Immigrants from Chile ($47,697, a difference of 0.21%).
| Demographics | Rating | Rank | Median Earnings |
| Immigrants | Nepal | 89.0 /100 | #137 | Excellent $47,925 |
| Europeans | 88.9 /100 | #138 | Excellent $47,915 |
| Canadians | 88.8 /100 | #139 | Excellent $47,911 |
| Taiwanese | 88.7 /100 | #140 | Excellent $47,902 |
| Immigrants | Sierra Leone | 88.3 /100 | #141 | Excellent $47,875 |
| Ugandans | 88.0 /100 | #142 | Excellent $47,854 |
| Swedes | 88.0 /100 | #143 | Excellent $47,851 |
| Hungarians | 87.1 /100 | #144 | Excellent $47,795 |
| Immigrants | Saudi Arabia | 85.6 /100 | #145 | Excellent $47,704 |
| Immigrants | Chile | 85.5 /100 | #146 | Excellent $47,697 |
| Immigrants | South Eastern Asia | 85.0 /100 | #147 | Excellent $47,671 |
| Immigrants | Eritrea | 84.8 /100 | #148 | Excellent $47,657 |
| Luxembourgers | 84.5 /100 | #149 | Excellent $47,640 |
| Peruvians | 84.2 /100 | #150 | Excellent $47,628 |
| Immigrants | Oceania | 84.1 /100 | #151 | Excellent $47,617 |
Demographics Similar to Lumbee by Median Earnings
In terms of median earnings, the demographic groups most similar to Lumbee are Hopi ($36,871, a difference of 0.010%), Pueblo ($36,859, a difference of 0.050%), Navajo ($36,999, a difference of 0.33%), Arapaho ($36,586, a difference of 0.79%), and Tohono O'odham ($36,349, a difference of 1.5%).
| Demographics | Rating | Rank | Median Earnings |
| Houma | 0.0 /100 | #333 | Tragic $38,949 |
| Spanish American Indians | 0.0 /100 | #334 | Tragic $38,907 |
| Natives/Alaskans | 0.0 /100 | #335 | Tragic $38,896 |
| Crow | 0.0 /100 | #336 | Tragic $38,707 |
| Immigrants | Cuba | 0.0 /100 | #337 | Tragic $38,426 |
| Pima | 0.0 /100 | #338 | Tragic $38,285 |
| Menominee | 0.0 /100 | #339 | Tragic $37,884 |
| Navajo | 0.0 /100 | #340 | Tragic $36,999 |
| Lumbee | 0.0 /100 | #341 | Tragic $36,876 |
| Hopi | 0.0 /100 | #342 | Tragic $36,871 |
| Pueblo | 0.0 /100 | #343 | Tragic $36,859 |
| Arapaho | 0.0 /100 | #344 | Tragic $36,586 |
| Tohono O'odham | 0.0 /100 | #345 | Tragic $36,349 |
| Yup'ik | 0.0 /100 | #346 | Tragic $35,942 |
| Puerto Ricans | 0.0 /100 | #347 | Tragic $35,560 |