Bhutanese vs Lumbee Median Earnings
COMPARE
Bhutanese
Lumbee
Median Earnings
Median Earnings Comparison
Bhutanese
Lumbee
$52,297
MEDIAN EARNINGS
100.0/ 100
METRIC RATING
46th/ 347
METRIC RANK
$36,876
MEDIAN EARNINGS
0.0/ 100
METRIC RATING
341st/ 347
METRIC RANK
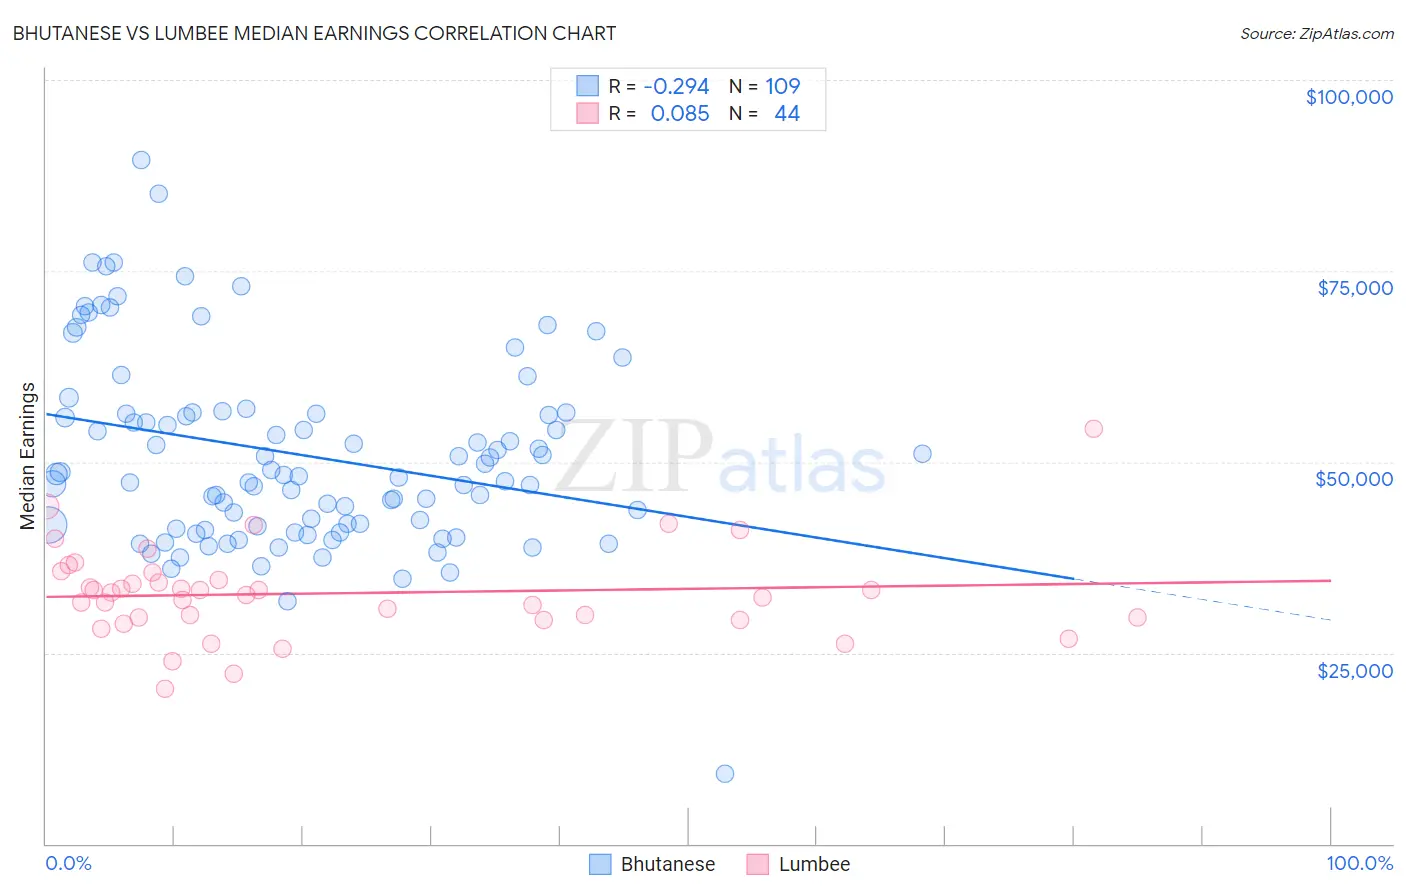
Bhutanese vs Lumbee Median Earnings Correlation Chart
The statistical analysis conducted on geographies consisting of 455,560,671 people shows a weak negative correlation between the proportion of Bhutanese and median earnings in the United States with a correlation coefficient (R) of -0.294 and weighted average of $52,297. Similarly, the statistical analysis conducted on geographies consisting of 92,282,036 people shows a slight positive correlation between the proportion of Lumbee and median earnings in the United States with a correlation coefficient (R) of 0.085 and weighted average of $36,876, a difference of 41.8%.
Median Earnings Correlation Summary
| Measurement | Bhutanese | Lumbee |
| Minimum | $9,211 | $20,337 |
| Maximum | $89,590 | $54,265 |
| Range | $80,379 | $33,928 |
| Mean | $50,906 | $32,791 |
| Median | $48,356 | $32,724 |
| Interquartile 25% (IQ1) | $41,435 | $29,449 |
| Interquartile 75% (IQ3) | $56,370 | $35,034 |
| Interquartile Range (IQR) | $14,935 | $5,585 |
| Standard Deviation (Sample) | $12,596 | $6,085 |
| Standard Deviation (Population) | $12,538 | $6,015 |
Similar Demographics by Median Earnings
Demographics Similar to Bhutanese by Median Earnings
In terms of median earnings, the demographic groups most similar to Bhutanese are Australian ($52,294, a difference of 0.010%), Immigrants from Czechoslovakia ($52,361, a difference of 0.12%), Immigrants from Europe ($52,195, a difference of 0.20%), Immigrants from Malaysia ($52,514, a difference of 0.41%), and Bulgarian ($52,512, a difference of 0.41%).
| Demographics | Rating | Rank | Median Earnings |
| Immigrants | Turkey | 100.0 /100 | #39 | Exceptional $52,960 |
| Israelis | 100.0 /100 | #40 | Exceptional $52,937 |
| Immigrants | Lithuania | 100.0 /100 | #41 | Exceptional $52,769 |
| Maltese | 100.0 /100 | #42 | Exceptional $52,526 |
| Immigrants | Malaysia | 100.0 /100 | #43 | Exceptional $52,514 |
| Bulgarians | 100.0 /100 | #44 | Exceptional $52,512 |
| Immigrants | Czechoslovakia | 100.0 /100 | #45 | Exceptional $52,361 |
| Bhutanese | 100.0 /100 | #46 | Exceptional $52,297 |
| Australians | 100.0 /100 | #47 | Exceptional $52,294 |
| Immigrants | Europe | 100.0 /100 | #48 | Exceptional $52,195 |
| Bolivians | 100.0 /100 | #49 | Exceptional $52,005 |
| Immigrants | South Africa | 100.0 /100 | #50 | Exceptional $51,850 |
| Immigrants | Austria | 99.9 /100 | #51 | Exceptional $51,826 |
| Estonians | 99.9 /100 | #52 | Exceptional $51,772 |
| Immigrants | Norway | 99.9 /100 | #53 | Exceptional $51,758 |
Demographics Similar to Lumbee by Median Earnings
In terms of median earnings, the demographic groups most similar to Lumbee are Hopi ($36,871, a difference of 0.010%), Pueblo ($36,859, a difference of 0.050%), Navajo ($36,999, a difference of 0.33%), Arapaho ($36,586, a difference of 0.79%), and Tohono O'odham ($36,349, a difference of 1.5%).
| Demographics | Rating | Rank | Median Earnings |
| Houma | 0.0 /100 | #333 | Tragic $38,949 |
| Spanish American Indians | 0.0 /100 | #334 | Tragic $38,907 |
| Natives/Alaskans | 0.0 /100 | #335 | Tragic $38,896 |
| Crow | 0.0 /100 | #336 | Tragic $38,707 |
| Immigrants | Cuba | 0.0 /100 | #337 | Tragic $38,426 |
| Pima | 0.0 /100 | #338 | Tragic $38,285 |
| Menominee | 0.0 /100 | #339 | Tragic $37,884 |
| Navajo | 0.0 /100 | #340 | Tragic $36,999 |
| Lumbee | 0.0 /100 | #341 | Tragic $36,876 |
| Hopi | 0.0 /100 | #342 | Tragic $36,871 |
| Pueblo | 0.0 /100 | #343 | Tragic $36,859 |
| Arapaho | 0.0 /100 | #344 | Tragic $36,586 |
| Tohono O'odham | 0.0 /100 | #345 | Tragic $36,349 |
| Yup'ik | 0.0 /100 | #346 | Tragic $35,942 |
| Puerto Ricans | 0.0 /100 | #347 | Tragic $35,560 |