Luxembourger vs Alsatian Median Earnings
COMPARE
Luxembourger
Alsatian
Median Earnings
Median Earnings Comparison
Luxembourgers
Alsatians
$47,640
MEDIAN EARNINGS
84.5/ 100
METRIC RATING
149th/ 347
METRIC RANK
$47,023
MEDIAN EARNINGS
69.6/ 100
METRIC RATING
160th/ 347
METRIC RANK
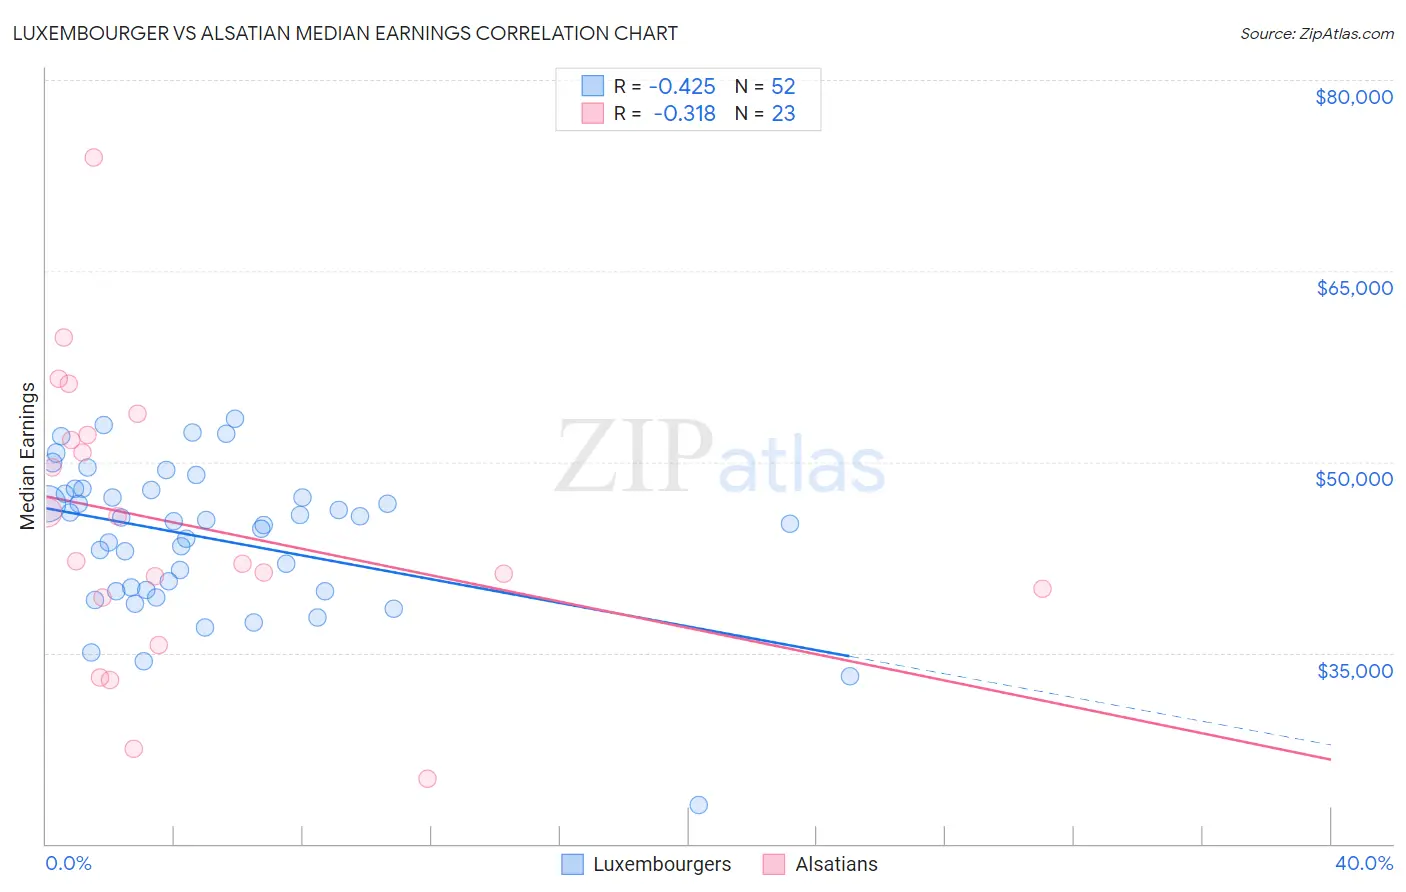
Luxembourger vs Alsatian Median Earnings Correlation Chart
The statistical analysis conducted on geographies consisting of 144,679,059 people shows a moderate negative correlation between the proportion of Luxembourgers and median earnings in the United States with a correlation coefficient (R) of -0.425 and weighted average of $47,640. Similarly, the statistical analysis conducted on geographies consisting of 82,677,221 people shows a mild negative correlation between the proportion of Alsatians and median earnings in the United States with a correlation coefficient (R) of -0.318 and weighted average of $47,023, a difference of 1.3%.
Median Earnings Correlation Summary
| Measurement | Luxembourger | Alsatian |
| Minimum | $23,065 | $25,064 |
| Maximum | $53,418 | $73,935 |
| Range | $30,353 | $48,871 |
| Mean | $43,977 | $45,093 |
| Median | $45,242 | $42,188 |
| Interquartile 25% (IQ1) | $39,899 | $39,345 |
| Interquartile 75% (IQ3) | $47,654 | $52,137 |
| Interquartile Range (IQR) | $7,755 | $12,792 |
| Standard Deviation (Sample) | $5,791 | $11,160 |
| Standard Deviation (Population) | $5,735 | $10,915 |
Demographics Similar to Luxembourgers and Alsatians by Median Earnings
In terms of median earnings, the demographic groups most similar to Luxembourgers are Peruvian ($47,628, a difference of 0.020%), Immigrants from Eritrea ($47,657, a difference of 0.040%), Immigrants from Oceania ($47,617, a difference of 0.050%), Immigrants from South Eastern Asia ($47,671, a difference of 0.060%), and Immigrants from Chile ($47,697, a difference of 0.12%). Similarly, the demographic groups most similar to Alsatians are Immigrants from Peru ($47,025, a difference of 0.0%), Immigrants from Eastern Africa ($46,969, a difference of 0.11%), Slovak ($47,095, a difference of 0.15%), South American Indian ($46,952, a difference of 0.15%), and Icelander ($46,916, a difference of 0.23%).
| Demographics | Rating | Rank | Median Earnings |
| Hungarians | 87.1 /100 | #144 | Excellent $47,795 |
| Immigrants | Saudi Arabia | 85.6 /100 | #145 | Excellent $47,704 |
| Immigrants | Chile | 85.5 /100 | #146 | Excellent $47,697 |
| Immigrants | South Eastern Asia | 85.0 /100 | #147 | Excellent $47,671 |
| Immigrants | Eritrea | 84.8 /100 | #148 | Excellent $47,657 |
| Luxembourgers | 84.5 /100 | #149 | Excellent $47,640 |
| Peruvians | 84.2 /100 | #150 | Excellent $47,628 |
| Immigrants | Oceania | 84.1 /100 | #151 | Excellent $47,617 |
| Immigrants | Germany | 83.1 /100 | #152 | Excellent $47,566 |
| Slavs | 81.1 /100 | #153 | Excellent $47,470 |
| Immigrants | Portugal | 77.3 /100 | #154 | Good $47,304 |
| Immigrants | Vietnam | 76.7 /100 | #155 | Good $47,282 |
| Irish | 76.6 /100 | #156 | Good $47,276 |
| Czechs | 75.1 /100 | #157 | Good $47,221 |
| Slovaks | 71.7 /100 | #158 | Good $47,095 |
| Immigrants | Peru | 69.6 /100 | #159 | Good $47,025 |
| Alsatians | 69.6 /100 | #160 | Good $47,023 |
| Immigrants | Eastern Africa | 68.0 /100 | #161 | Good $46,969 |
| South American Indians | 67.4 /100 | #162 | Good $46,952 |
| Icelanders | 66.3 /100 | #163 | Good $46,916 |
| Norwegians | 64.7 /100 | #164 | Good $46,865 |