German vs Lumbee Median Earnings
COMPARE
German
Lumbee
Median Earnings
Median Earnings Comparison
Germans
Lumbee
$45,935
MEDIAN EARNINGS
33.2/ 100
METRIC RATING
192nd/ 347
METRIC RANK
$36,876
MEDIAN EARNINGS
0.0/ 100
METRIC RATING
341st/ 347
METRIC RANK
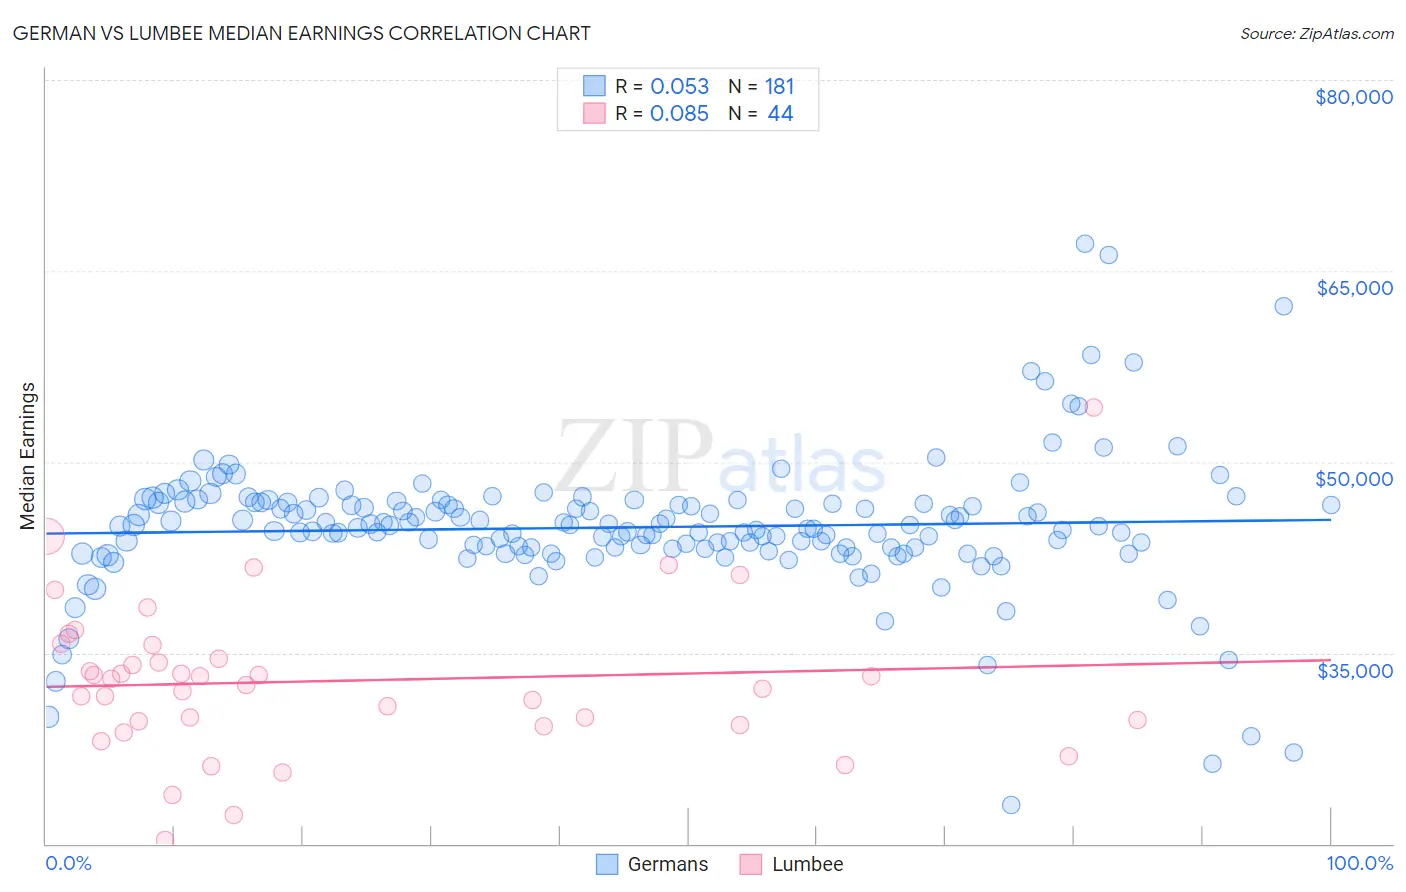
German vs Lumbee Median Earnings Correlation Chart
The statistical analysis conducted on geographies consisting of 580,480,068 people shows a slight positive correlation between the proportion of Germans and median earnings in the United States with a correlation coefficient (R) of 0.053 and weighted average of $45,935. Similarly, the statistical analysis conducted on geographies consisting of 92,282,036 people shows a slight positive correlation between the proportion of Lumbee and median earnings in the United States with a correlation coefficient (R) of 0.085 and weighted average of $36,876, a difference of 24.6%.
Median Earnings Correlation Summary
| Measurement | German | Lumbee |
| Minimum | $23,082 | $20,337 |
| Maximum | $67,100 | $54,265 |
| Range | $44,018 | $33,928 |
| Mean | $44,861 | $32,791 |
| Median | $44,941 | $32,724 |
| Interquartile 25% (IQ1) | $43,214 | $29,449 |
| Interquartile 75% (IQ3) | $46,790 | $35,034 |
| Interquartile Range (IQR) | $3,576 | $5,585 |
| Standard Deviation (Sample) | $5,408 | $6,085 |
| Standard Deviation (Population) | $5,393 | $6,015 |
Similar Demographics by Median Earnings
Demographics Similar to Germans by Median Earnings
In terms of median earnings, the demographic groups most similar to Germans are Guamanian/Chamorro ($45,933, a difference of 0.0%), Finnish ($45,940, a difference of 0.010%), Immigrants from Costa Rica ($45,928, a difference of 0.020%), Immigrants from St. Vincent and the Grenadines ($45,908, a difference of 0.060%), and Yugoslavian ($45,846, a difference of 0.19%).
| Demographics | Rating | Rank | Median Earnings |
| Uruguayans | 41.6 /100 | #185 | Average $46,190 |
| Vietnamese | 40.9 /100 | #186 | Average $46,172 |
| Iraqis | 39.9 /100 | #187 | Fair $46,140 |
| Immigrants | Armenia | 38.3 /100 | #188 | Fair $46,094 |
| Spaniards | 37.2 /100 | #189 | Fair $46,059 |
| French Canadians | 36.1 /100 | #190 | Fair $46,026 |
| Finns | 33.4 /100 | #191 | Fair $45,940 |
| Germans | 33.2 /100 | #192 | Fair $45,935 |
| Guamanians/Chamorros | 33.2 /100 | #193 | Fair $45,933 |
| Immigrants | Costa Rica | 33.0 /100 | #194 | Fair $45,928 |
| Immigrants | St. Vincent and the Grenadines | 32.4 /100 | #195 | Fair $45,908 |
| Yugoslavians | 30.5 /100 | #196 | Fair $45,846 |
| Barbadians | 30.5 /100 | #197 | Fair $45,846 |
| Trinidadians and Tobagonians | 29.7 /100 | #198 | Fair $45,820 |
| Immigrants | Barbados | 29.6 /100 | #199 | Fair $45,816 |
Demographics Similar to Lumbee by Median Earnings
In terms of median earnings, the demographic groups most similar to Lumbee are Hopi ($36,871, a difference of 0.010%), Pueblo ($36,859, a difference of 0.050%), Navajo ($36,999, a difference of 0.33%), Arapaho ($36,586, a difference of 0.79%), and Tohono O'odham ($36,349, a difference of 1.5%).
| Demographics | Rating | Rank | Median Earnings |
| Houma | 0.0 /100 | #333 | Tragic $38,949 |
| Spanish American Indians | 0.0 /100 | #334 | Tragic $38,907 |
| Natives/Alaskans | 0.0 /100 | #335 | Tragic $38,896 |
| Crow | 0.0 /100 | #336 | Tragic $38,707 |
| Immigrants | Cuba | 0.0 /100 | #337 | Tragic $38,426 |
| Pima | 0.0 /100 | #338 | Tragic $38,285 |
| Menominee | 0.0 /100 | #339 | Tragic $37,884 |
| Navajo | 0.0 /100 | #340 | Tragic $36,999 |
| Lumbee | 0.0 /100 | #341 | Tragic $36,876 |
| Hopi | 0.0 /100 | #342 | Tragic $36,871 |
| Pueblo | 0.0 /100 | #343 | Tragic $36,859 |
| Arapaho | 0.0 /100 | #344 | Tragic $36,586 |
| Tohono O'odham | 0.0 /100 | #345 | Tragic $36,349 |
| Yup'ik | 0.0 /100 | #346 | Tragic $35,942 |
| Puerto Ricans | 0.0 /100 | #347 | Tragic $35,560 |