Luxembourger vs Liberian Median Earnings
COMPARE
Luxembourger
Liberian
Median Earnings
Median Earnings Comparison
Luxembourgers
Liberians
$47,640
MEDIAN EARNINGS
84.5/ 100
METRIC RATING
149th/ 347
METRIC RANK
$43,536
MEDIAN EARNINGS
1.7/ 100
METRIC RATING
254th/ 347
METRIC RANK
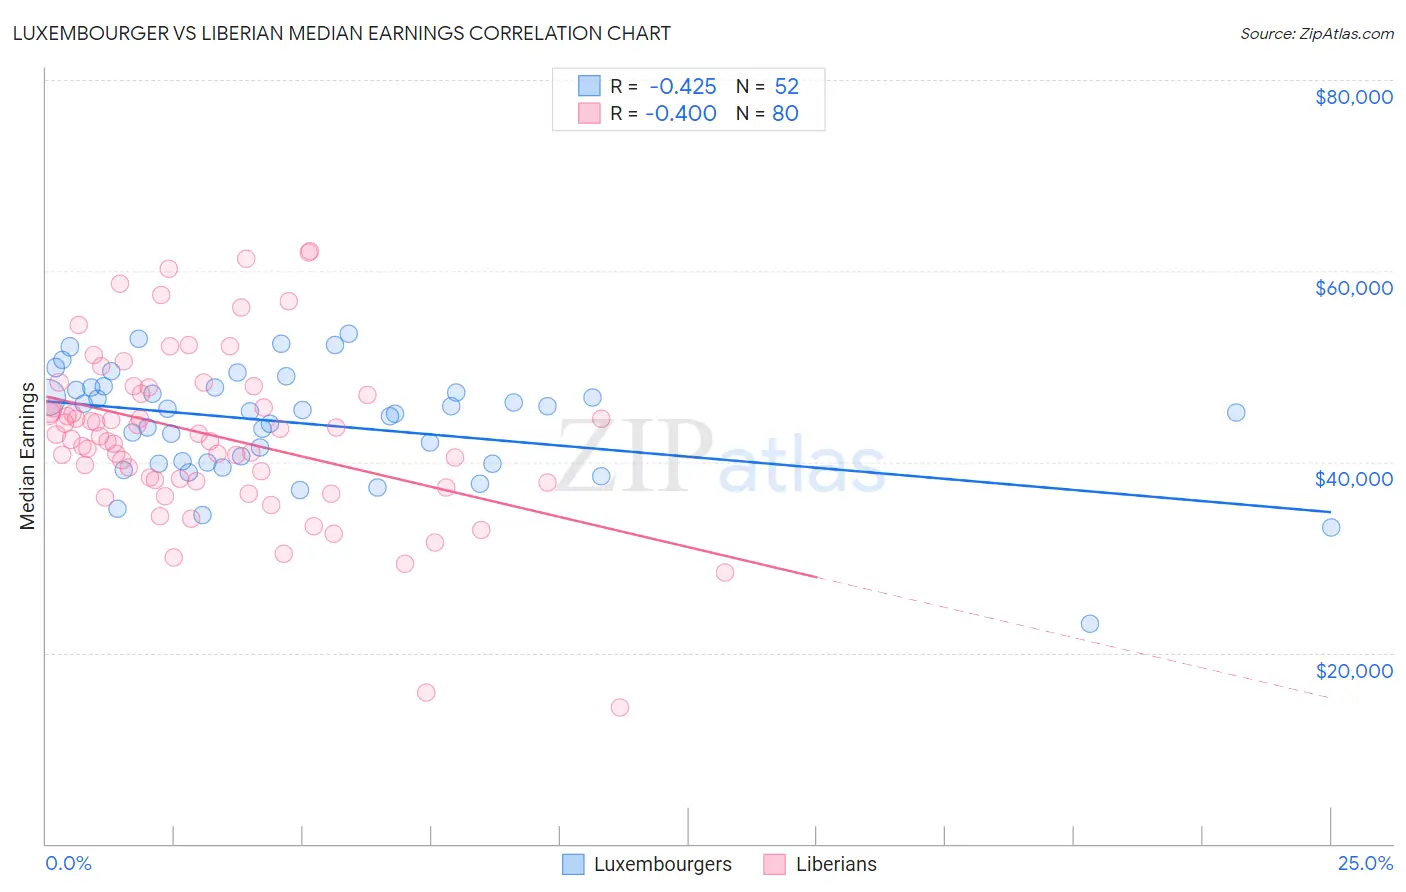
Luxembourger vs Liberian Median Earnings Correlation Chart
The statistical analysis conducted on geographies consisting of 144,679,059 people shows a moderate negative correlation between the proportion of Luxembourgers and median earnings in the United States with a correlation coefficient (R) of -0.425 and weighted average of $47,640. Similarly, the statistical analysis conducted on geographies consisting of 118,107,140 people shows a mild negative correlation between the proportion of Liberians and median earnings in the United States with a correlation coefficient (R) of -0.400 and weighted average of $43,536, a difference of 9.4%.
Median Earnings Correlation Summary
| Measurement | Luxembourger | Liberian |
| Minimum | $23,065 | $14,336 |
| Maximum | $53,418 | $62,030 |
| Range | $30,353 | $47,694 |
| Mean | $43,977 | $42,795 |
| Median | $45,242 | $42,751 |
| Interquartile 25% (IQ1) | $39,899 | $38,041 |
| Interquartile 75% (IQ3) | $47,654 | $47,442 |
| Interquartile Range (IQR) | $7,755 | $9,402 |
| Standard Deviation (Sample) | $5,791 | $8,910 |
| Standard Deviation (Population) | $5,735 | $8,855 |
Similar Demographics by Median Earnings
Demographics Similar to Luxembourgers by Median Earnings
In terms of median earnings, the demographic groups most similar to Luxembourgers are Peruvian ($47,628, a difference of 0.020%), Immigrants from Eritrea ($47,657, a difference of 0.040%), Immigrants from Oceania ($47,617, a difference of 0.050%), Immigrants from South Eastern Asia ($47,671, a difference of 0.060%), and Immigrants from Chile ($47,697, a difference of 0.12%).
| Demographics | Rating | Rank | Median Earnings |
| Ugandans | 88.0 /100 | #142 | Excellent $47,854 |
| Swedes | 88.0 /100 | #143 | Excellent $47,851 |
| Hungarians | 87.1 /100 | #144 | Excellent $47,795 |
| Immigrants | Saudi Arabia | 85.6 /100 | #145 | Excellent $47,704 |
| Immigrants | Chile | 85.5 /100 | #146 | Excellent $47,697 |
| Immigrants | South Eastern Asia | 85.0 /100 | #147 | Excellent $47,671 |
| Immigrants | Eritrea | 84.8 /100 | #148 | Excellent $47,657 |
| Luxembourgers | 84.5 /100 | #149 | Excellent $47,640 |
| Peruvians | 84.2 /100 | #150 | Excellent $47,628 |
| Immigrants | Oceania | 84.1 /100 | #151 | Excellent $47,617 |
| Immigrants | Germany | 83.1 /100 | #152 | Excellent $47,566 |
| Slavs | 81.1 /100 | #153 | Excellent $47,470 |
| Immigrants | Portugal | 77.3 /100 | #154 | Good $47,304 |
| Immigrants | Vietnam | 76.7 /100 | #155 | Good $47,282 |
| Irish | 76.6 /100 | #156 | Good $47,276 |
Demographics Similar to Liberians by Median Earnings
In terms of median earnings, the demographic groups most similar to Liberians are Somali ($43,567, a difference of 0.070%), Immigrants from Middle Africa ($43,416, a difference of 0.28%), Hawaiian ($43,673, a difference of 0.31%), Alaskan Athabascan ($43,393, a difference of 0.33%), and Tsimshian ($43,695, a difference of 0.37%).
| Demographics | Rating | Rank | Median Earnings |
| Immigrants | Cabo Verde | 3.0 /100 | #247 | Tragic $43,963 |
| Nepalese | 2.6 /100 | #248 | Tragic $43,860 |
| Malaysians | 2.6 /100 | #249 | Tragic $43,844 |
| Alaska Natives | 2.3 /100 | #250 | Tragic $43,750 |
| Tsimshian | 2.1 /100 | #251 | Tragic $43,695 |
| Hawaiians | 2.0 /100 | #252 | Tragic $43,673 |
| Somalis | 1.8 /100 | #253 | Tragic $43,567 |
| Liberians | 1.7 /100 | #254 | Tragic $43,536 |
| Immigrants | Middle Africa | 1.4 /100 | #255 | Tragic $43,416 |
| Alaskan Athabascans | 1.4 /100 | #256 | Tragic $43,393 |
| Jamaicans | 1.3 /100 | #257 | Tragic $43,343 |
| French American Indians | 1.3 /100 | #258 | Tragic $43,333 |
| German Russians | 1.1 /100 | #259 | Tragic $43,200 |
| Immigrants | Somalia | 0.9 /100 | #260 | Tragic $43,100 |
| Immigrants | Jamaica | 0.8 /100 | #261 | Tragic $43,026 |