Immigrants from Belgium vs Latvian Median Earnings
COMPARE
Immigrants from Belgium
Latvian
Median Earnings
Median Earnings Comparison
Immigrants from Belgium
Latvians
$54,679
MEDIAN EARNINGS
100.0/ 100
METRIC RATING
19th/ 347
METRIC RANK
$53,001
MEDIAN EARNINGS
100.0/ 100
METRIC RATING
38th/ 347
METRIC RANK
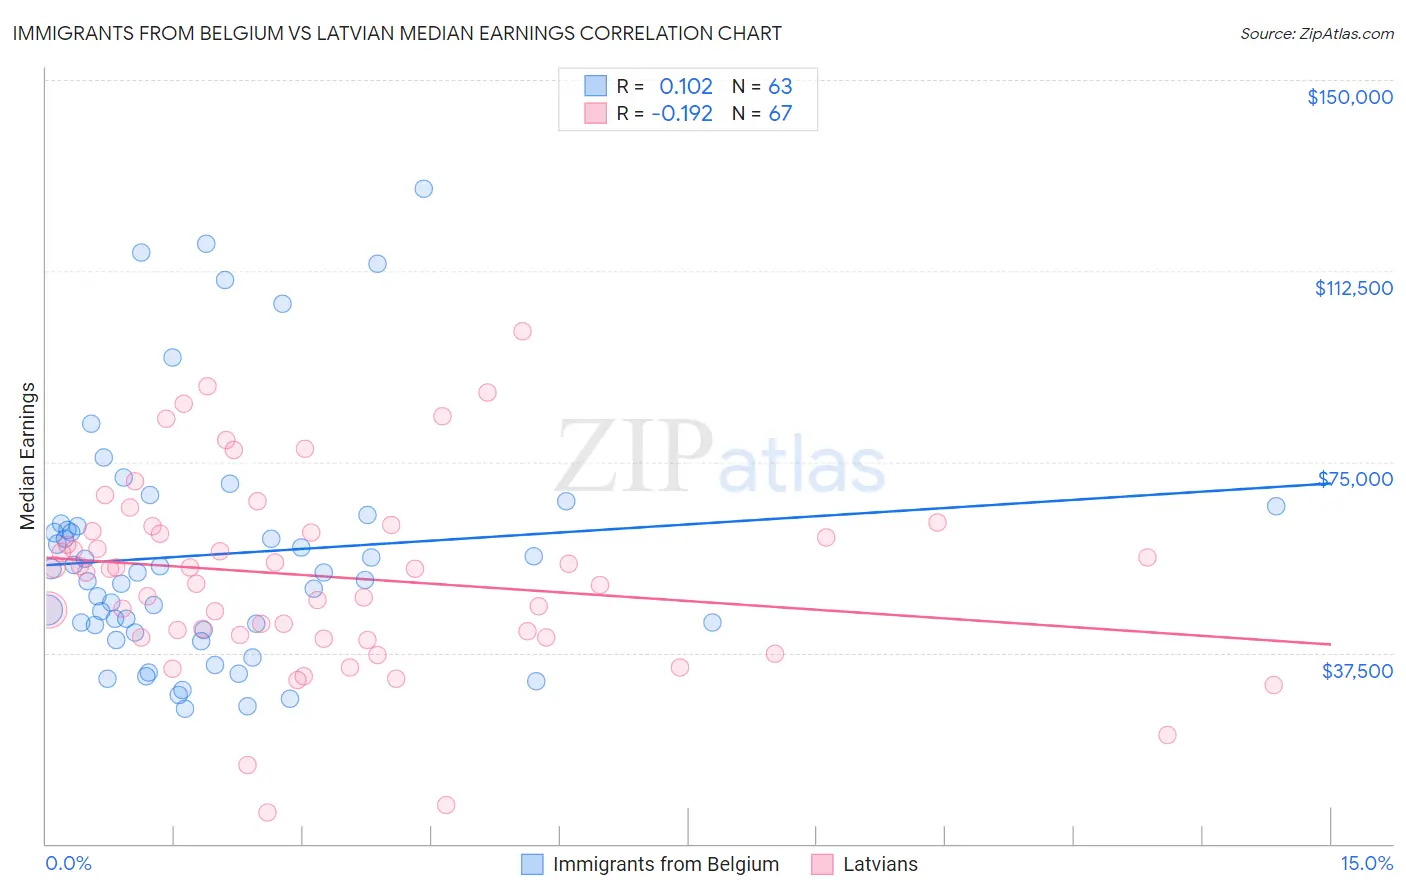
Immigrants from Belgium vs Latvian Median Earnings Correlation Chart
The statistical analysis conducted on geographies consisting of 146,713,420 people shows a poor positive correlation between the proportion of Immigrants from Belgium and median earnings in the United States with a correlation coefficient (R) of 0.102 and weighted average of $54,679. Similarly, the statistical analysis conducted on geographies consisting of 220,722,204 people shows a poor negative correlation between the proportion of Latvians and median earnings in the United States with a correlation coefficient (R) of -0.192 and weighted average of $53,001, a difference of 3.2%.
Median Earnings Correlation Summary
| Measurement | Immigrants from Belgium | Latvian |
| Minimum | $26,625 | $6,196 |
| Maximum | $128,750 | $100,625 |
| Range | $102,125 | $94,429 |
| Mean | $56,854 | $52,387 |
| Median | $53,265 | $53,984 |
| Interquartile 25% (IQ1) | $41,924 | $40,578 |
| Interquartile 75% (IQ3) | $62,836 | $61,313 |
| Interquartile Range (IQR) | $20,912 | $20,735 |
| Standard Deviation (Sample) | $23,786 | $18,625 |
| Standard Deviation (Population) | $23,597 | $18,485 |
Demographics Similar to Immigrants from Belgium and Latvians by Median Earnings
In terms of median earnings, the demographic groups most similar to Immigrants from Belgium are Cypriot ($54,589, a difference of 0.16%), Burmese ($54,559, a difference of 0.22%), Immigrants from Korea ($54,530, a difference of 0.27%), Immigrants from Sweden ($54,478, a difference of 0.37%), and Immigrants from Japan ($54,938, a difference of 0.47%). Similarly, the demographic groups most similar to Latvians are Immigrants from Belarus ($53,043, a difference of 0.080%), Immigrants from Denmark ($53,186, a difference of 0.35%), Immigrants from Switzerland ($53,211, a difference of 0.40%), Immigrants from Sri Lanka ($53,268, a difference of 0.50%), and Immigrants from Greece ($53,282, a difference of 0.53%).
| Demographics | Rating | Rank | Median Earnings |
| Immigrants | Japan | 100.0 /100 | #18 | Exceptional $54,938 |
| Immigrants | Belgium | 100.0 /100 | #19 | Exceptional $54,679 |
| Cypriots | 100.0 /100 | #20 | Exceptional $54,589 |
| Burmese | 100.0 /100 | #21 | Exceptional $54,559 |
| Immigrants | Korea | 100.0 /100 | #22 | Exceptional $54,530 |
| Immigrants | Sweden | 100.0 /100 | #23 | Exceptional $54,478 |
| Soviet Union | 100.0 /100 | #24 | Exceptional $54,290 |
| Turks | 100.0 /100 | #25 | Exceptional $53,919 |
| Immigrants | Northern Europe | 100.0 /100 | #26 | Exceptional $53,872 |
| Asians | 100.0 /100 | #27 | Exceptional $53,690 |
| Immigrants | France | 100.0 /100 | #28 | Exceptional $53,490 |
| Immigrants | Russia | 100.0 /100 | #29 | Exceptional $53,457 |
| Cambodians | 100.0 /100 | #30 | Exceptional $53,386 |
| Russians | 100.0 /100 | #31 | Exceptional $53,334 |
| Immigrants | Asia | 100.0 /100 | #32 | Exceptional $53,310 |
| Immigrants | Greece | 100.0 /100 | #33 | Exceptional $53,282 |
| Immigrants | Sri Lanka | 100.0 /100 | #34 | Exceptional $53,268 |
| Immigrants | Switzerland | 100.0 /100 | #35 | Exceptional $53,211 |
| Immigrants | Denmark | 100.0 /100 | #36 | Exceptional $53,186 |
| Immigrants | Belarus | 100.0 /100 | #37 | Exceptional $53,043 |
| Latvians | 100.0 /100 | #38 | Exceptional $53,001 |