European vs Latvian Median Earnings
COMPARE
European
Latvian
Median Earnings
Median Earnings Comparison
Europeans
Latvians
$47,915
MEDIAN EARNINGS
88.9/ 100
METRIC RATING
138th/ 347
METRIC RANK
$53,001
MEDIAN EARNINGS
100.0/ 100
METRIC RATING
38th/ 347
METRIC RANK
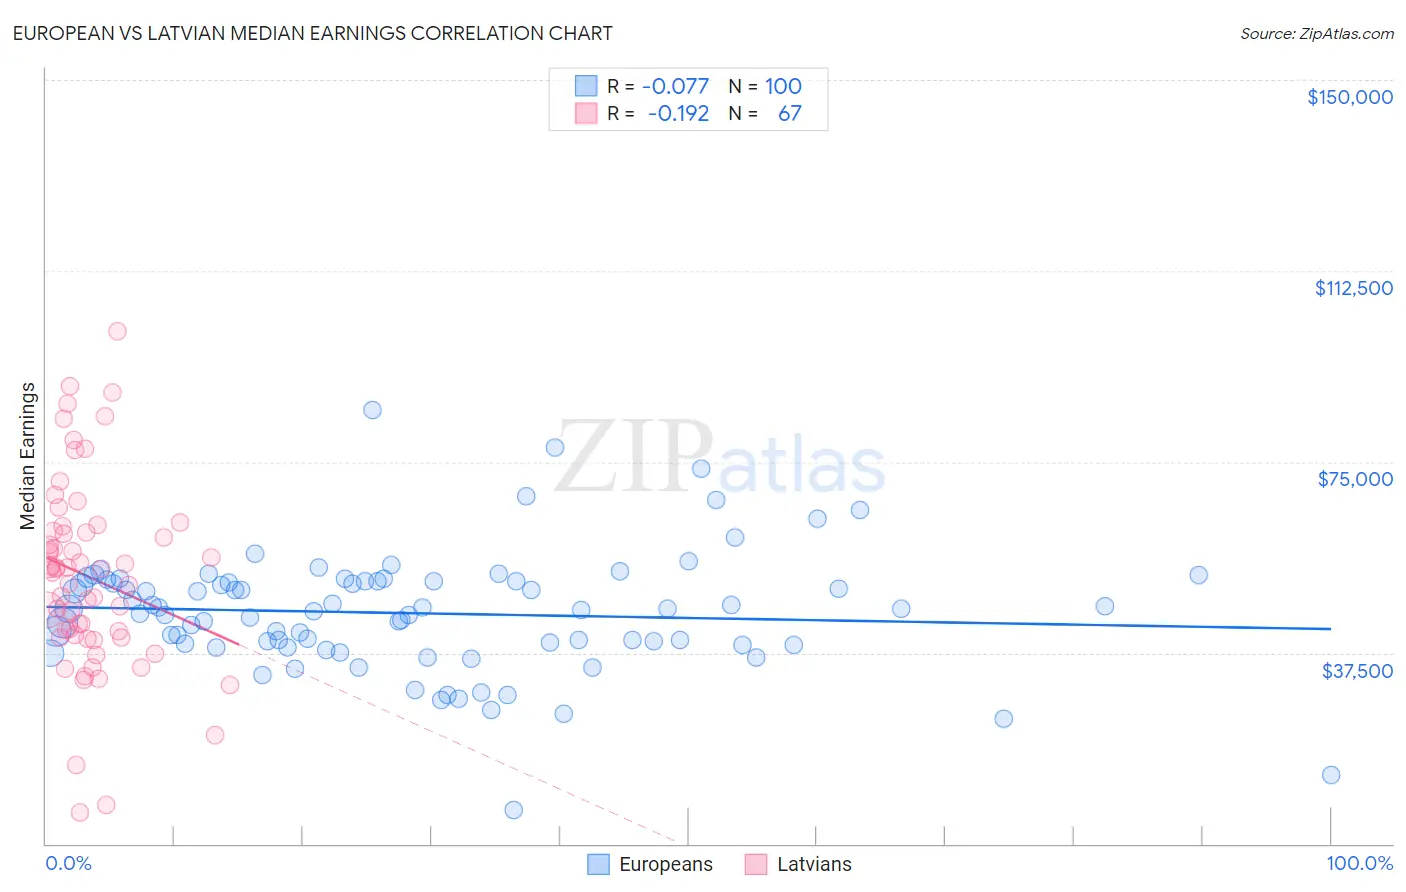
European vs Latvian Median Earnings Correlation Chart
The statistical analysis conducted on geographies consisting of 561,558,991 people shows a slight negative correlation between the proportion of Europeans and median earnings in the United States with a correlation coefficient (R) of -0.077 and weighted average of $47,915. Similarly, the statistical analysis conducted on geographies consisting of 220,722,204 people shows a poor negative correlation between the proportion of Latvians and median earnings in the United States with a correlation coefficient (R) of -0.192 and weighted average of $53,001, a difference of 10.6%.
Median Earnings Correlation Summary
| Measurement | European | Latvian |
| Minimum | $6,651 | $6,196 |
| Maximum | $85,181 | $100,625 |
| Range | $78,530 | $94,429 |
| Mean | $45,294 | $52,387 |
| Median | $45,994 | $53,984 |
| Interquartile 25% (IQ1) | $39,170 | $40,578 |
| Interquartile 75% (IQ3) | $51,535 | $61,313 |
| Interquartile Range (IQR) | $12,364 | $20,735 |
| Standard Deviation (Sample) | $11,738 | $18,625 |
| Standard Deviation (Population) | $11,679 | $18,485 |
Similar Demographics by Median Earnings
Demographics Similar to Europeans by Median Earnings
In terms of median earnings, the demographic groups most similar to Europeans are Canadian ($47,911, a difference of 0.010%), Immigrants from Nepal ($47,925, a difference of 0.020%), Taiwanese ($47,902, a difference of 0.030%), Immigrants from Sierra Leone ($47,875, a difference of 0.080%), and Ugandan ($47,854, a difference of 0.13%).
| Demographics | Rating | Rank | Median Earnings |
| Lebanese | 92.5 /100 | #131 | Exceptional $48,226 |
| British | 92.2 /100 | #132 | Exceptional $48,189 |
| Immigrants | Uganda | 90.5 /100 | #133 | Exceptional $48,041 |
| Sri Lankans | 90.5 /100 | #134 | Exceptional $48,040 |
| Portuguese | 90.4 /100 | #135 | Exceptional $48,032 |
| Slovenes | 90.0 /100 | #136 | Excellent $47,995 |
| Immigrants | Nepal | 89.0 /100 | #137 | Excellent $47,925 |
| Europeans | 88.9 /100 | #138 | Excellent $47,915 |
| Canadians | 88.8 /100 | #139 | Excellent $47,911 |
| Taiwanese | 88.7 /100 | #140 | Excellent $47,902 |
| Immigrants | Sierra Leone | 88.3 /100 | #141 | Excellent $47,875 |
| Ugandans | 88.0 /100 | #142 | Excellent $47,854 |
| Swedes | 88.0 /100 | #143 | Excellent $47,851 |
| Hungarians | 87.1 /100 | #144 | Excellent $47,795 |
| Immigrants | Saudi Arabia | 85.6 /100 | #145 | Excellent $47,704 |
Demographics Similar to Latvians by Median Earnings
In terms of median earnings, the demographic groups most similar to Latvians are Immigrants from Belarus ($53,043, a difference of 0.080%), Immigrants from Turkey ($52,960, a difference of 0.080%), Israeli ($52,937, a difference of 0.12%), Immigrants from Denmark ($53,186, a difference of 0.35%), and Immigrants from Switzerland ($53,211, a difference of 0.40%).
| Demographics | Rating | Rank | Median Earnings |
| Russians | 100.0 /100 | #31 | Exceptional $53,334 |
| Immigrants | Asia | 100.0 /100 | #32 | Exceptional $53,310 |
| Immigrants | Greece | 100.0 /100 | #33 | Exceptional $53,282 |
| Immigrants | Sri Lanka | 100.0 /100 | #34 | Exceptional $53,268 |
| Immigrants | Switzerland | 100.0 /100 | #35 | Exceptional $53,211 |
| Immigrants | Denmark | 100.0 /100 | #36 | Exceptional $53,186 |
| Immigrants | Belarus | 100.0 /100 | #37 | Exceptional $53,043 |
| Latvians | 100.0 /100 | #38 | Exceptional $53,001 |
| Immigrants | Turkey | 100.0 /100 | #39 | Exceptional $52,960 |
| Israelis | 100.0 /100 | #40 | Exceptional $52,937 |
| Immigrants | Lithuania | 100.0 /100 | #41 | Exceptional $52,769 |
| Maltese | 100.0 /100 | #42 | Exceptional $52,526 |
| Immigrants | Malaysia | 100.0 /100 | #43 | Exceptional $52,514 |
| Bulgarians | 100.0 /100 | #44 | Exceptional $52,512 |
| Immigrants | Czechoslovakia | 100.0 /100 | #45 | Exceptional $52,361 |