Hopi vs Latvian Median Earnings
COMPARE
Hopi
Latvian
Median Earnings
Median Earnings Comparison
Hopi
Latvians
$36,871
MEDIAN EARNINGS
0.0/ 100
METRIC RATING
342nd/ 347
METRIC RANK
$53,001
MEDIAN EARNINGS
100.0/ 100
METRIC RATING
38th/ 347
METRIC RANK
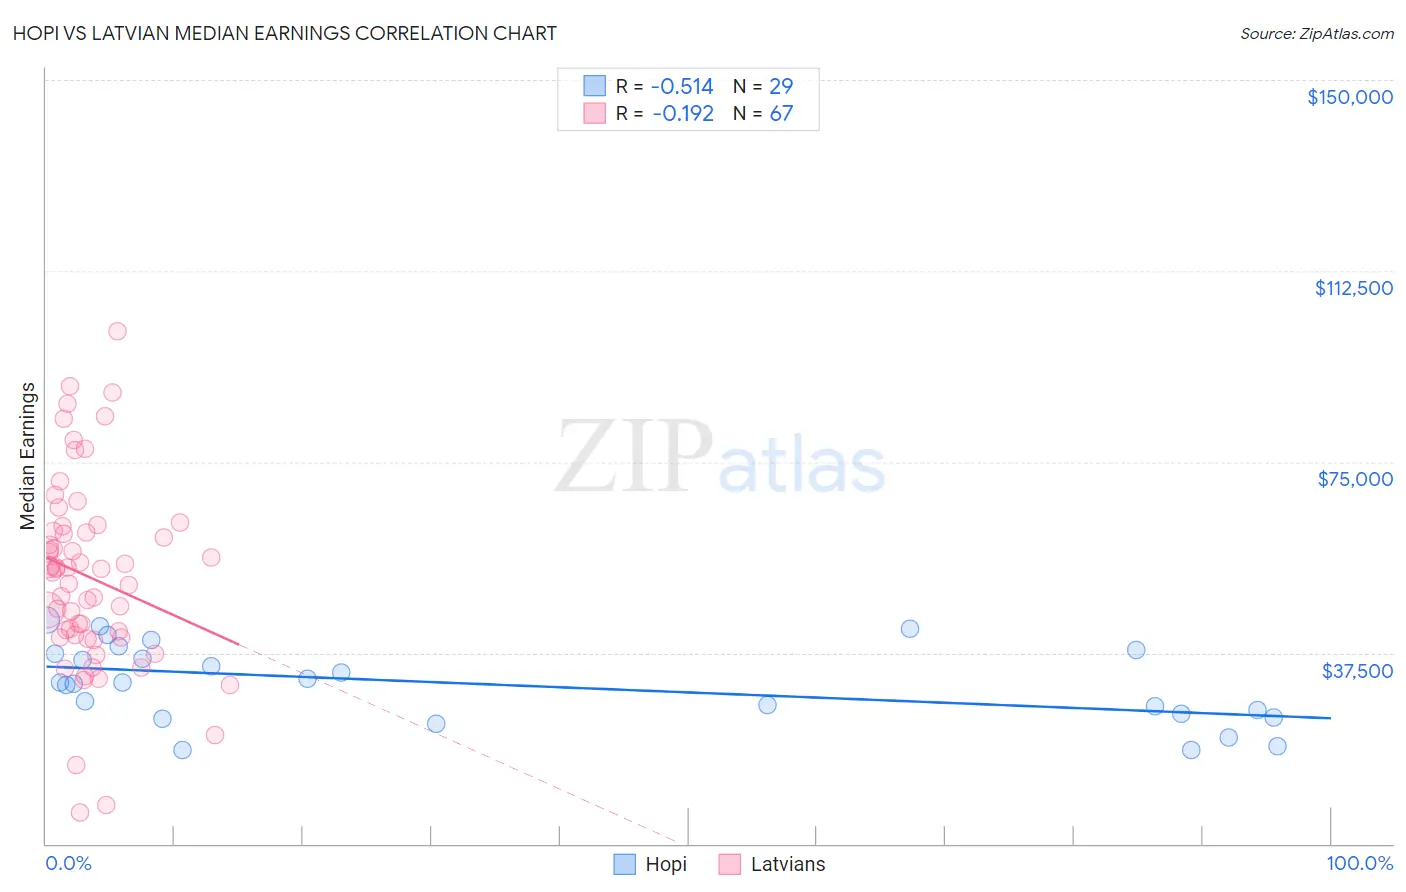
Hopi vs Latvian Median Earnings Correlation Chart
The statistical analysis conducted on geographies consisting of 74,737,278 people shows a substantial negative correlation between the proportion of Hopi and median earnings in the United States with a correlation coefficient (R) of -0.514 and weighted average of $36,871. Similarly, the statistical analysis conducted on geographies consisting of 220,722,204 people shows a poor negative correlation between the proportion of Latvians and median earnings in the United States with a correlation coefficient (R) of -0.192 and weighted average of $53,001, a difference of 43.8%.
Median Earnings Correlation Summary
| Measurement | Hopi | Latvian |
| Minimum | $18,419 | $6,196 |
| Maximum | $44,002 | $100,625 |
| Range | $25,583 | $94,429 |
| Mean | $31,290 | $52,387 |
| Median | $31,645 | $53,984 |
| Interquartile 25% (IQ1) | $25,144 | $40,578 |
| Interquartile 75% (IQ3) | $37,681 | $61,313 |
| Interquartile Range (IQR) | $12,537 | $20,735 |
| Standard Deviation (Sample) | $7,605 | $18,625 |
| Standard Deviation (Population) | $7,472 | $18,485 |
Similar Demographics by Median Earnings
Demographics Similar to Hopi by Median Earnings
In terms of median earnings, the demographic groups most similar to Hopi are Lumbee ($36,876, a difference of 0.010%), Pueblo ($36,859, a difference of 0.030%), Navajo ($36,999, a difference of 0.35%), Arapaho ($36,586, a difference of 0.78%), and Tohono O'odham ($36,349, a difference of 1.4%).
| Demographics | Rating | Rank | Median Earnings |
| Houma | 0.0 /100 | #333 | Tragic $38,949 |
| Spanish American Indians | 0.0 /100 | #334 | Tragic $38,907 |
| Natives/Alaskans | 0.0 /100 | #335 | Tragic $38,896 |
| Crow | 0.0 /100 | #336 | Tragic $38,707 |
| Immigrants | Cuba | 0.0 /100 | #337 | Tragic $38,426 |
| Pima | 0.0 /100 | #338 | Tragic $38,285 |
| Menominee | 0.0 /100 | #339 | Tragic $37,884 |
| Navajo | 0.0 /100 | #340 | Tragic $36,999 |
| Lumbee | 0.0 /100 | #341 | Tragic $36,876 |
| Hopi | 0.0 /100 | #342 | Tragic $36,871 |
| Pueblo | 0.0 /100 | #343 | Tragic $36,859 |
| Arapaho | 0.0 /100 | #344 | Tragic $36,586 |
| Tohono O'odham | 0.0 /100 | #345 | Tragic $36,349 |
| Yup'ik | 0.0 /100 | #346 | Tragic $35,942 |
| Puerto Ricans | 0.0 /100 | #347 | Tragic $35,560 |
Demographics Similar to Latvians by Median Earnings
In terms of median earnings, the demographic groups most similar to Latvians are Immigrants from Belarus ($53,043, a difference of 0.080%), Immigrants from Turkey ($52,960, a difference of 0.080%), Israeli ($52,937, a difference of 0.12%), Immigrants from Denmark ($53,186, a difference of 0.35%), and Immigrants from Switzerland ($53,211, a difference of 0.40%).
| Demographics | Rating | Rank | Median Earnings |
| Russians | 100.0 /100 | #31 | Exceptional $53,334 |
| Immigrants | Asia | 100.0 /100 | #32 | Exceptional $53,310 |
| Immigrants | Greece | 100.0 /100 | #33 | Exceptional $53,282 |
| Immigrants | Sri Lanka | 100.0 /100 | #34 | Exceptional $53,268 |
| Immigrants | Switzerland | 100.0 /100 | #35 | Exceptional $53,211 |
| Immigrants | Denmark | 100.0 /100 | #36 | Exceptional $53,186 |
| Immigrants | Belarus | 100.0 /100 | #37 | Exceptional $53,043 |
| Latvians | 100.0 /100 | #38 | Exceptional $53,001 |
| Immigrants | Turkey | 100.0 /100 | #39 | Exceptional $52,960 |
| Israelis | 100.0 /100 | #40 | Exceptional $52,937 |
| Immigrants | Lithuania | 100.0 /100 | #41 | Exceptional $52,769 |
| Maltese | 100.0 /100 | #42 | Exceptional $52,526 |
| Immigrants | Malaysia | 100.0 /100 | #43 | Exceptional $52,514 |
| Bulgarians | 100.0 /100 | #44 | Exceptional $52,512 |
| Immigrants | Czechoslovakia | 100.0 /100 | #45 | Exceptional $52,361 |