Luxembourger vs Latvian Doctorate Degree
COMPARE
Luxembourger
Latvian
Doctorate Degree
Doctorate Degree Comparison
Luxembourgers
Latvians
1.9%
DOCTORATE DEGREE
81.1/ 100
METRIC RATING
148th/ 347
METRIC RANK
2.6%
DOCTORATE DEGREE
100.0/ 100
METRIC RATING
31st/ 347
METRIC RANK
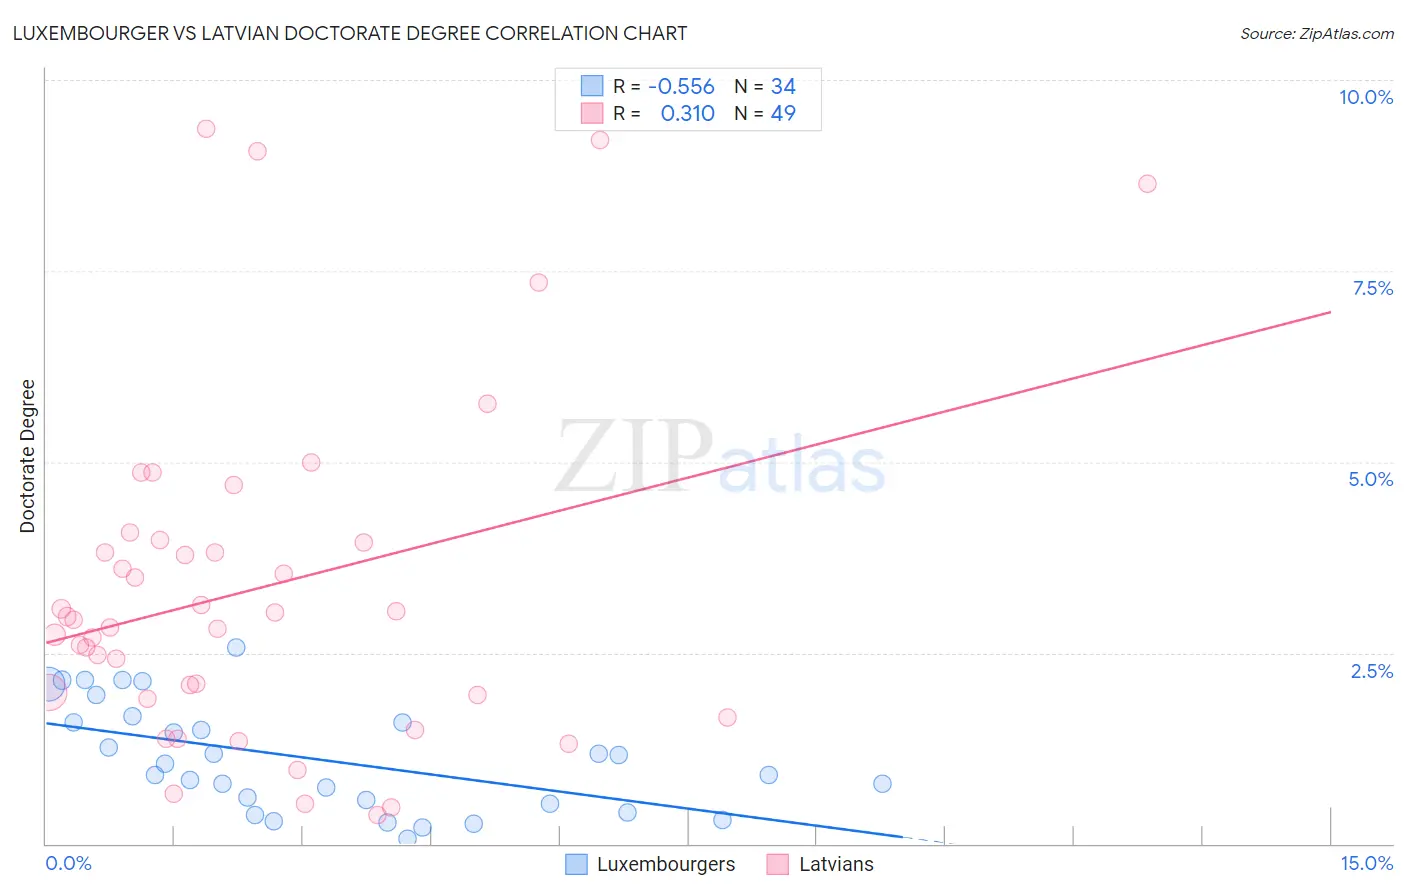
Luxembourger vs Latvian Doctorate Degree Correlation Chart
The statistical analysis conducted on geographies consisting of 144,093,078 people shows a substantial negative correlation between the proportion of Luxembourgers and percentage of population with at least doctorate degree education in the United States with a correlation coefficient (R) of -0.556 and weighted average of 1.9%. Similarly, the statistical analysis conducted on geographies consisting of 219,954,299 people shows a mild positive correlation between the proportion of Latvians and percentage of population with at least doctorate degree education in the United States with a correlation coefficient (R) of 0.310 and weighted average of 2.6%, a difference of 33.0%.
Doctorate Degree Correlation Summary
| Measurement | Luxembourger | Latvian |
| Minimum | 0.063% | 0.38% |
| Maximum | 2.6% | 9.4% |
| Range | 2.5% | 9.0% |
| Mean | 1.1% | 3.3% |
| Median | 0.98% | 2.9% |
| Interquartile 25% (IQ1) | 0.52% | 1.9% |
| Interquartile 75% (IQ3) | 1.6% | 4.0% |
| Interquartile Range (IQR) | 1.1% | 2.0% |
| Standard Deviation (Sample) | 0.70% | 2.2% |
| Standard Deviation (Population) | 0.69% | 2.2% |
Similar Demographics by Doctorate Degree
Demographics Similar to Luxembourgers by Doctorate Degree
In terms of doctorate degree, the demographic groups most similar to Luxembourgers are Immigrants from Senegal (1.9%, a difference of 0.33%), Immigrants from Syria (1.9%, a difference of 0.58%), Kenyan (1.9%, a difference of 0.60%), Immigrants from Moldova (2.0%, a difference of 0.78%), and Basque (1.9%, a difference of 0.90%).
| Demographics | Rating | Rank | Doctorate Degree |
| Senegalese | 86.7 /100 | #141 | Excellent 2.0% |
| Italians | 86.0 /100 | #142 | Excellent 2.0% |
| Sierra Leoneans | 85.1 /100 | #143 | Excellent 2.0% |
| Immigrants | Moldova | 84.3 /100 | #144 | Excellent 2.0% |
| Kenyans | 83.6 /100 | #145 | Excellent 1.9% |
| Immigrants | Syria | 83.6 /100 | #146 | Excellent 1.9% |
| Immigrants | Senegal | 82.5 /100 | #147 | Excellent 1.9% |
| Luxembourgers | 81.1 /100 | #148 | Excellent 1.9% |
| Basques | 76.9 /100 | #149 | Good 1.9% |
| English | 75.9 /100 | #150 | Good 1.9% |
| Albanians | 74.8 /100 | #151 | Good 1.9% |
| Immigrants | Kenya | 74.3 /100 | #152 | Good 1.9% |
| Immigrants | Oceania | 74.0 /100 | #153 | Good 1.9% |
| Immigrants | Albania | 72.8 /100 | #154 | Good 1.9% |
| Poles | 72.7 /100 | #155 | Good 1.9% |
Demographics Similar to Latvians by Doctorate Degree
In terms of doctorate degree, the demographic groups most similar to Latvians are Immigrants from Northern Europe (2.6%, a difference of 0.15%), Cambodian (2.6%, a difference of 0.33%), Cypriot (2.6%, a difference of 0.44%), Immigrants from Malaysia (2.6%, a difference of 0.50%), and Immigrants from Spain (2.6%, a difference of 0.56%).
| Demographics | Rating | Rank | Doctorate Degree |
| Israelis | 100.0 /100 | #24 | Exceptional 2.7% |
| Immigrants | Saudi Arabia | 100.0 /100 | #25 | Exceptional 2.7% |
| Turks | 100.0 /100 | #26 | Exceptional 2.7% |
| Immigrants | Turkey | 100.0 /100 | #27 | Exceptional 2.6% |
| Burmese | 100.0 /100 | #28 | Exceptional 2.6% |
| Immigrants | South Central Asia | 100.0 /100 | #29 | Exceptional 2.6% |
| Immigrants | Korea | 100.0 /100 | #30 | Exceptional 2.6% |
| Latvians | 100.0 /100 | #31 | Exceptional 2.6% |
| Immigrants | Northern Europe | 100.0 /100 | #32 | Exceptional 2.6% |
| Cambodians | 100.0 /100 | #33 | Exceptional 2.6% |
| Cypriots | 100.0 /100 | #34 | Exceptional 2.6% |
| Immigrants | Malaysia | 100.0 /100 | #35 | Exceptional 2.6% |
| Immigrants | Spain | 100.0 /100 | #36 | Exceptional 2.6% |
| Immigrants | Kuwait | 100.0 /100 | #37 | Exceptional 2.6% |
| Russians | 100.0 /100 | #38 | Exceptional 2.6% |