Lithuanian vs Immigrants from Uruguay Wage/Income Gap
COMPARE
Lithuanian
Immigrants from Uruguay
Wage/Income Gap
Wage/Income Gap Comparison
Lithuanians
Immigrants from Uruguay
28.7%
WAGE/INCOME GAP
0.1/ 100
METRIC RATING
316th/ 347
METRIC RANK
24.6%
WAGE/INCOME GAP
93.8/ 100
METRIC RATING
126th/ 347
METRIC RANK
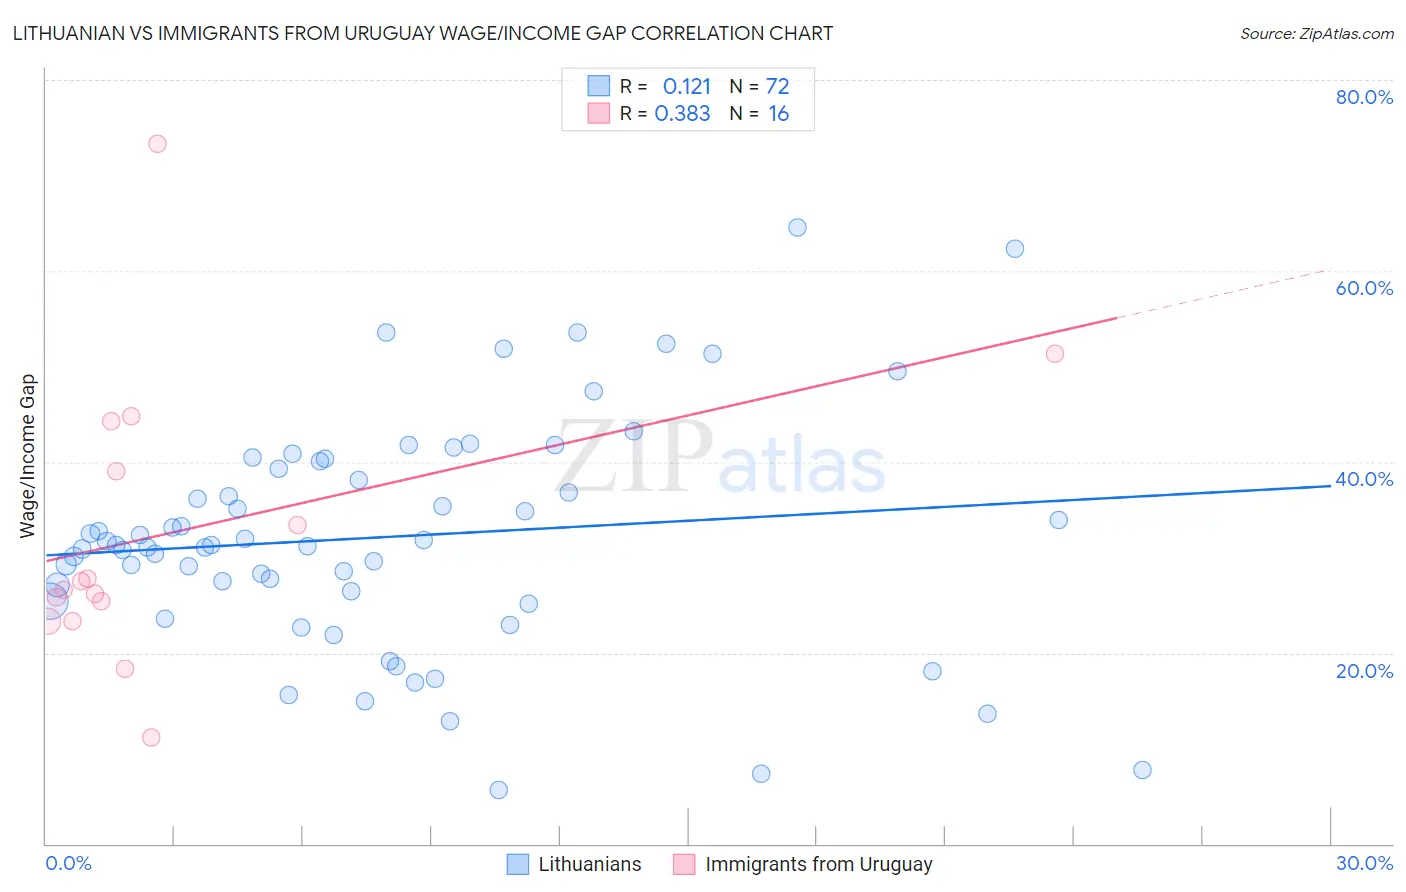
Lithuanian vs Immigrants from Uruguay Wage/Income Gap Correlation Chart
The statistical analysis conducted on geographies consisting of 421,511,979 people shows a poor positive correlation between the proportion of Lithuanians and wage/income gap percentage in the United States with a correlation coefficient (R) of 0.121 and weighted average of 28.7%. Similarly, the statistical analysis conducted on geographies consisting of 133,243,894 people shows a mild positive correlation between the proportion of Immigrants from Uruguay and wage/income gap percentage in the United States with a correlation coefficient (R) of 0.383 and weighted average of 24.6%, a difference of 16.7%.
Wage/Income Gap Correlation Summary
| Measurement | Lithuanian | Immigrants from Uruguay |
| Minimum | 5.6% | 11.1% |
| Maximum | 64.5% | 73.3% |
| Range | 58.9% | 62.2% |
| Mean | 32.1% | 32.6% |
| Median | 31.3% | 27.1% |
| Interquartile 25% (IQ1) | 25.9% | 24.3% |
| Interquartile 75% (IQ3) | 39.7% | 41.7% |
| Interquartile Range (IQR) | 13.8% | 17.3% |
| Standard Deviation (Sample) | 12.1% | 15.1% |
| Standard Deviation (Population) | 12.0% | 14.6% |
Similar Demographics by Wage/Income Gap
Demographics Similar to Lithuanians by Wage/Income Gap
In terms of wage/income gap, the demographic groups most similar to Lithuanians are Maltese (28.7%, a difference of 0.010%), Immigrants from Scotland (28.7%, a difference of 0.060%), Belgian (28.8%, a difference of 0.11%), Basque (28.8%, a difference of 0.16%), and French (28.7%, a difference of 0.20%).
| Demographics | Rating | Rank | Wage/Income Gap |
| Macedonians | 0.1 /100 | #309 | Tragic 28.6% |
| Finns | 0.1 /100 | #310 | Tragic 28.6% |
| Immigrants | Lithuania | 0.1 /100 | #311 | Tragic 28.6% |
| Eastern Europeans | 0.1 /100 | #312 | Tragic 28.6% |
| French | 0.1 /100 | #313 | Tragic 28.7% |
| Immigrants | Scotland | 0.1 /100 | #314 | Tragic 28.7% |
| Maltese | 0.1 /100 | #315 | Tragic 28.7% |
| Lithuanians | 0.1 /100 | #316 | Tragic 28.7% |
| Belgians | 0.1 /100 | #317 | Tragic 28.8% |
| Basques | 0.1 /100 | #318 | Tragic 28.8% |
| Slovaks | 0.1 /100 | #319 | Tragic 28.9% |
| British | 0.1 /100 | #320 | Tragic 28.9% |
| Welsh | 0.1 /100 | #321 | Tragic 28.9% |
| Immigrants | Singapore | 0.1 /100 | #322 | Tragic 28.9% |
| Norwegians | 0.1 /100 | #323 | Tragic 29.0% |
Demographics Similar to Immigrants from Uruguay by Wage/Income Gap
In terms of wage/income gap, the demographic groups most similar to Immigrants from Uruguay are German Russian (24.6%, a difference of 0.010%), Spanish American (24.6%, a difference of 0.020%), Immigrants from South America (24.6%, a difference of 0.040%), Immigrants from Central America (24.6%, a difference of 0.070%), and Yup'ik (24.7%, a difference of 0.13%).
| Demographics | Rating | Rank | Wage/Income Gap |
| Kenyans | 95.8 /100 | #119 | Exceptional 24.5% |
| Cree | 95.6 /100 | #120 | Exceptional 24.5% |
| Immigrants | Thailand | 94.9 /100 | #121 | Exceptional 24.5% |
| Apache | 94.8 /100 | #122 | Exceptional 24.5% |
| Natives/Alaskans | 94.6 /100 | #123 | Exceptional 24.6% |
| Immigrants | South America | 93.9 /100 | #124 | Exceptional 24.6% |
| Spanish Americans | 93.8 /100 | #125 | Exceptional 24.6% |
| Immigrants | Uruguay | 93.8 /100 | #126 | Exceptional 24.6% |
| German Russians | 93.7 /100 | #127 | Exceptional 24.6% |
| Immigrants | Central America | 93.5 /100 | #128 | Exceptional 24.6% |
| Yup'ik | 93.3 /100 | #129 | Exceptional 24.7% |
| Alsatians | 93.2 /100 | #130 | Exceptional 24.7% |
| Immigrants | Philippines | 93.0 /100 | #131 | Exceptional 24.7% |
| Immigrants | Costa Rica | 92.4 /100 | #132 | Exceptional 24.7% |
| Colombians | 92.4 /100 | #133 | Exceptional 24.7% |