Lithuanian vs Immigrants from Czechoslovakia Wage/Income Gap
COMPARE
Lithuanian
Immigrants from Czechoslovakia
Wage/Income Gap
Wage/Income Gap Comparison
Lithuanians
Immigrants from Czechoslovakia
28.7%
WAGE/INCOME GAP
0.1/ 100
METRIC RATING
316th/ 347
METRIC RANK
27.3%
WAGE/INCOME GAP
2.7/ 100
METRIC RATING
250th/ 347
METRIC RANK
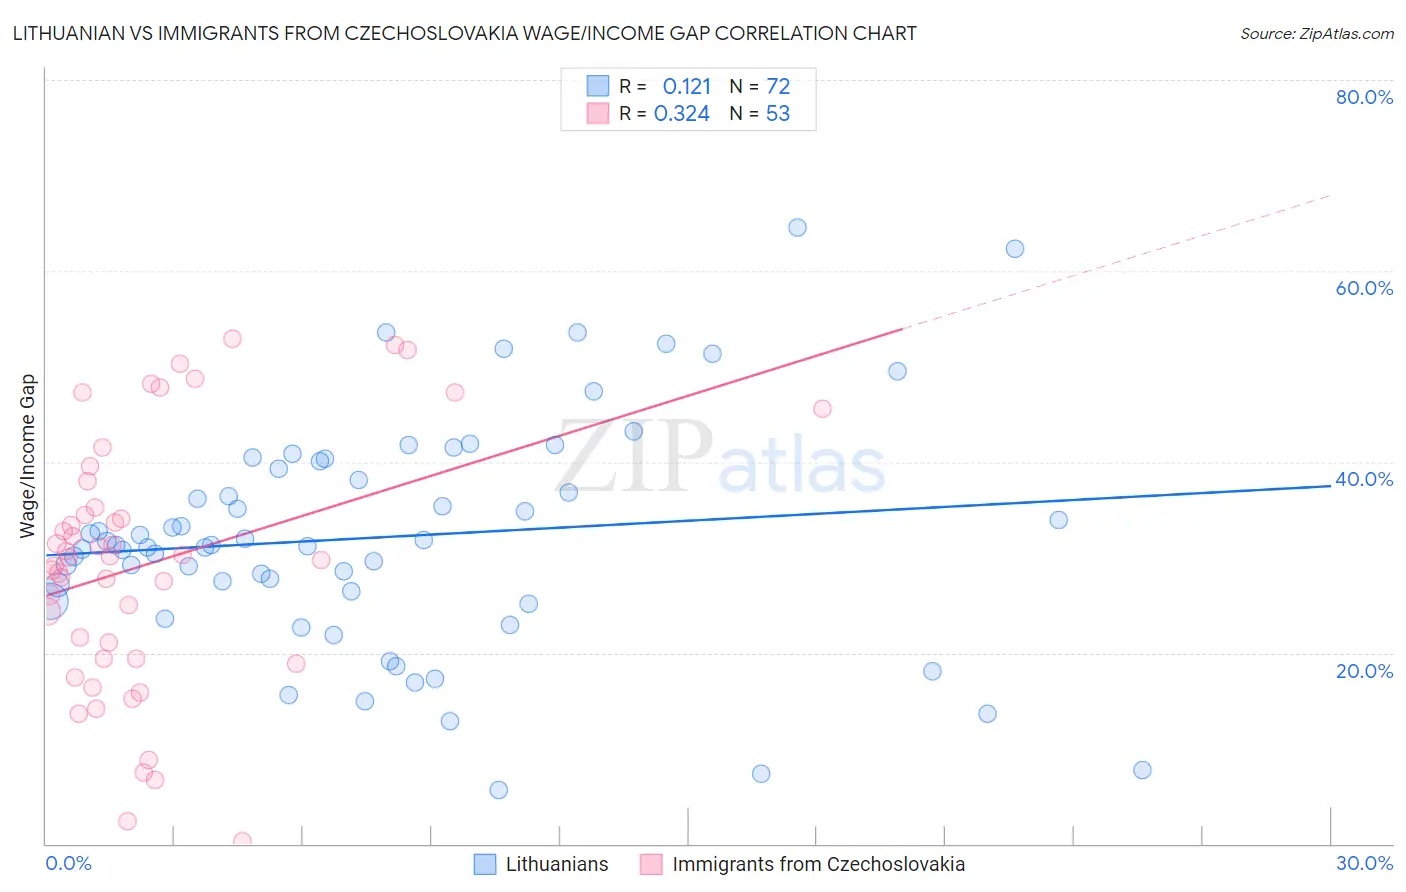
Lithuanian vs Immigrants from Czechoslovakia Wage/Income Gap Correlation Chart
The statistical analysis conducted on geographies consisting of 421,511,979 people shows a poor positive correlation between the proportion of Lithuanians and wage/income gap percentage in the United States with a correlation coefficient (R) of 0.121 and weighted average of 28.7%. Similarly, the statistical analysis conducted on geographies consisting of 195,414,700 people shows a mild positive correlation between the proportion of Immigrants from Czechoslovakia and wage/income gap percentage in the United States with a correlation coefficient (R) of 0.324 and weighted average of 27.3%, a difference of 5.4%.
Wage/Income Gap Correlation Summary
| Measurement | Lithuanian | Immigrants from Czechoslovakia |
| Minimum | 5.6% | 0.26% |
| Maximum | 64.5% | 52.9% |
| Range | 58.9% | 52.6% |
| Mean | 32.1% | 29.3% |
| Median | 31.3% | 30.0% |
| Interquartile 25% (IQ1) | 25.9% | 19.4% |
| Interquartile 75% (IQ3) | 39.7% | 36.6% |
| Interquartile Range (IQR) | 13.8% | 17.2% |
| Standard Deviation (Sample) | 12.1% | 13.3% |
| Standard Deviation (Population) | 12.0% | 13.1% |
Similar Demographics by Wage/Income Gap
Demographics Similar to Lithuanians by Wage/Income Gap
In terms of wage/income gap, the demographic groups most similar to Lithuanians are Maltese (28.7%, a difference of 0.010%), Immigrants from Scotland (28.7%, a difference of 0.060%), Belgian (28.8%, a difference of 0.11%), Basque (28.8%, a difference of 0.16%), and French (28.7%, a difference of 0.20%).
| Demographics | Rating | Rank | Wage/Income Gap |
| Macedonians | 0.1 /100 | #309 | Tragic 28.6% |
| Finns | 0.1 /100 | #310 | Tragic 28.6% |
| Immigrants | Lithuania | 0.1 /100 | #311 | Tragic 28.6% |
| Eastern Europeans | 0.1 /100 | #312 | Tragic 28.6% |
| French | 0.1 /100 | #313 | Tragic 28.7% |
| Immigrants | Scotland | 0.1 /100 | #314 | Tragic 28.7% |
| Maltese | 0.1 /100 | #315 | Tragic 28.7% |
| Lithuanians | 0.1 /100 | #316 | Tragic 28.7% |
| Belgians | 0.1 /100 | #317 | Tragic 28.8% |
| Basques | 0.1 /100 | #318 | Tragic 28.8% |
| Slovaks | 0.1 /100 | #319 | Tragic 28.9% |
| British | 0.1 /100 | #320 | Tragic 28.9% |
| Welsh | 0.1 /100 | #321 | Tragic 28.9% |
| Immigrants | Singapore | 0.1 /100 | #322 | Tragic 28.9% |
| Norwegians | 0.1 /100 | #323 | Tragic 29.0% |
Demographics Similar to Immigrants from Czechoslovakia by Wage/Income Gap
In terms of wage/income gap, the demographic groups most similar to Immigrants from Czechoslovakia are Cypriot (27.3%, a difference of 0.020%), Carpatho Rusyn (27.3%, a difference of 0.020%), Celtic (27.3%, a difference of 0.030%), Immigrants from Norway (27.3%, a difference of 0.10%), and Ukrainian (27.3%, a difference of 0.16%).
| Demographics | Rating | Rank | Wage/Income Gap |
| Spanish | 3.6 /100 | #243 | Tragic 27.1% |
| Chickasaw | 3.5 /100 | #244 | Tragic 27.2% |
| Immigrants | Azores | 3.5 /100 | #245 | Tragic 27.2% |
| Immigrants | Nonimmigrants | 3.3 /100 | #246 | Tragic 27.2% |
| Celtics | 2.8 /100 | #247 | Tragic 27.3% |
| Cypriots | 2.8 /100 | #248 | Tragic 27.3% |
| Carpatho Rusyns | 2.7 /100 | #249 | Tragic 27.3% |
| Immigrants | Czechoslovakia | 2.7 /100 | #250 | Tragic 27.3% |
| Immigrants | Norway | 2.5 /100 | #251 | Tragic 27.3% |
| Ukrainians | 2.4 /100 | #252 | Tragic 27.3% |
| Portuguese | 2.2 /100 | #253 | Tragic 27.4% |
| Israelis | 2.1 /100 | #254 | Tragic 27.4% |
| Immigrants | France | 2.1 /100 | #255 | Tragic 27.4% |
| Cherokee | 1.9 /100 | #256 | Tragic 27.4% |
| Luxembourgers | 1.9 /100 | #257 | Tragic 27.4% |