Lithuanian vs U.S. Virgin Islander Wage/Income Gap
COMPARE
Lithuanian
U.S. Virgin Islander
Wage/Income Gap
Wage/Income Gap Comparison
Lithuanians
U.S. Virgin Islanders
28.7%
WAGE/INCOME GAP
0.1/ 100
METRIC RATING
316th/ 347
METRIC RANK
21.5%
WAGE/INCOME GAP
100.0/ 100
METRIC RATING
45th/ 347
METRIC RANK
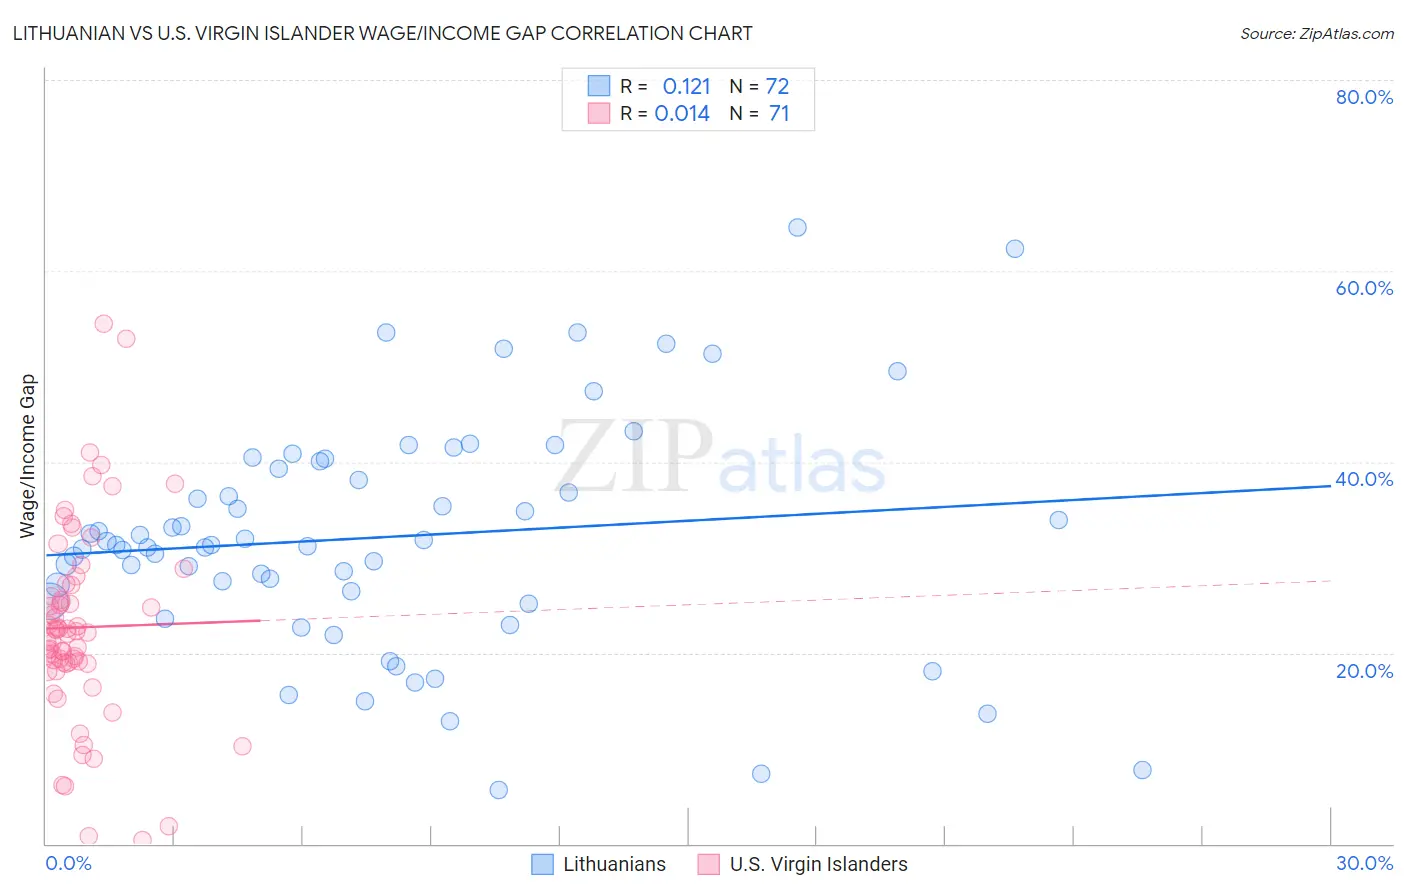
Lithuanian vs U.S. Virgin Islander Wage/Income Gap Correlation Chart
The statistical analysis conducted on geographies consisting of 421,511,979 people shows a poor positive correlation between the proportion of Lithuanians and wage/income gap percentage in the United States with a correlation coefficient (R) of 0.121 and weighted average of 28.7%. Similarly, the statistical analysis conducted on geographies consisting of 87,518,353 people shows no correlation between the proportion of U.S. Virgin Islanders and wage/income gap percentage in the United States with a correlation coefficient (R) of 0.014 and weighted average of 21.5%, a difference of 33.4%.
Wage/Income Gap Correlation Summary
| Measurement | Lithuanian | U.S. Virgin Islander |
| Minimum | 5.6% | 0.43% |
| Maximum | 64.5% | 54.4% |
| Range | 58.9% | 54.0% |
| Mean | 32.1% | 22.7% |
| Median | 31.3% | 22.1% |
| Interquartile 25% (IQ1) | 25.9% | 18.9% |
| Interquartile 75% (IQ3) | 39.7% | 27.2% |
| Interquartile Range (IQR) | 13.8% | 8.2% |
| Standard Deviation (Sample) | 12.1% | 10.2% |
| Standard Deviation (Population) | 12.0% | 10.1% |
Similar Demographics by Wage/Income Gap
Demographics Similar to Lithuanians by Wage/Income Gap
In terms of wage/income gap, the demographic groups most similar to Lithuanians are Maltese (28.7%, a difference of 0.010%), Immigrants from Scotland (28.7%, a difference of 0.060%), Belgian (28.8%, a difference of 0.11%), Basque (28.8%, a difference of 0.16%), and French (28.7%, a difference of 0.20%).
| Demographics | Rating | Rank | Wage/Income Gap |
| Macedonians | 0.1 /100 | #309 | Tragic 28.6% |
| Finns | 0.1 /100 | #310 | Tragic 28.6% |
| Immigrants | Lithuania | 0.1 /100 | #311 | Tragic 28.6% |
| Eastern Europeans | 0.1 /100 | #312 | Tragic 28.6% |
| French | 0.1 /100 | #313 | Tragic 28.7% |
| Immigrants | Scotland | 0.1 /100 | #314 | Tragic 28.7% |
| Maltese | 0.1 /100 | #315 | Tragic 28.7% |
| Lithuanians | 0.1 /100 | #316 | Tragic 28.7% |
| Belgians | 0.1 /100 | #317 | Tragic 28.8% |
| Basques | 0.1 /100 | #318 | Tragic 28.8% |
| Slovaks | 0.1 /100 | #319 | Tragic 28.9% |
| British | 0.1 /100 | #320 | Tragic 28.9% |
| Welsh | 0.1 /100 | #321 | Tragic 28.9% |
| Immigrants | Singapore | 0.1 /100 | #322 | Tragic 28.9% |
| Norwegians | 0.1 /100 | #323 | Tragic 29.0% |
Demographics Similar to U.S. Virgin Islanders by Wage/Income Gap
In terms of wage/income gap, the demographic groups most similar to U.S. Virgin Islanders are Immigrants from Ethiopia (21.6%, a difference of 0.12%), Immigrants from Eritrea (21.4%, a difference of 0.44%), Sierra Leonean (21.4%, a difference of 0.46%), Liberian (21.4%, a difference of 0.52%), and Immigrants from Sierra Leone (21.4%, a difference of 0.52%).
| Demographics | Rating | Rank | Wage/Income Gap |
| Immigrants | Belize | 100.0 /100 | #38 | Exceptional 21.3% |
| Colville | 100.0 /100 | #39 | Exceptional 21.3% |
| Lumbee | 100.0 /100 | #40 | Exceptional 21.3% |
| Liberians | 100.0 /100 | #41 | Exceptional 21.4% |
| Immigrants | Sierra Leone | 100.0 /100 | #42 | Exceptional 21.4% |
| Sierra Leoneans | 100.0 /100 | #43 | Exceptional 21.4% |
| Immigrants | Eritrea | 100.0 /100 | #44 | Exceptional 21.4% |
| U.S. Virgin Islanders | 100.0 /100 | #45 | Exceptional 21.5% |
| Immigrants | Ethiopia | 100.0 /100 | #46 | Exceptional 21.6% |
| Immigrants | Congo | 100.0 /100 | #47 | Exceptional 21.7% |
| Blacks/African Americans | 100.0 /100 | #48 | Exceptional 21.7% |
| Ethiopians | 100.0 /100 | #49 | Exceptional 21.8% |
| Immigrants | Western Africa | 100.0 /100 | #50 | Exceptional 22.0% |
| Tohono O'odham | 100.0 /100 | #51 | Exceptional 22.1% |
| Immigrants | Cameroon | 100.0 /100 | #52 | Exceptional 22.2% |