Dutch vs Immigrants from Uruguay Wage/Income Gap
COMPARE
Dutch
Immigrants from Uruguay
Wage/Income Gap
Wage/Income Gap Comparison
Dutch
Immigrants from Uruguay
29.6%
WAGE/INCOME GAP
0.0/ 100
METRIC RATING
337th/ 347
METRIC RANK
24.6%
WAGE/INCOME GAP
93.8/ 100
METRIC RATING
126th/ 347
METRIC RANK
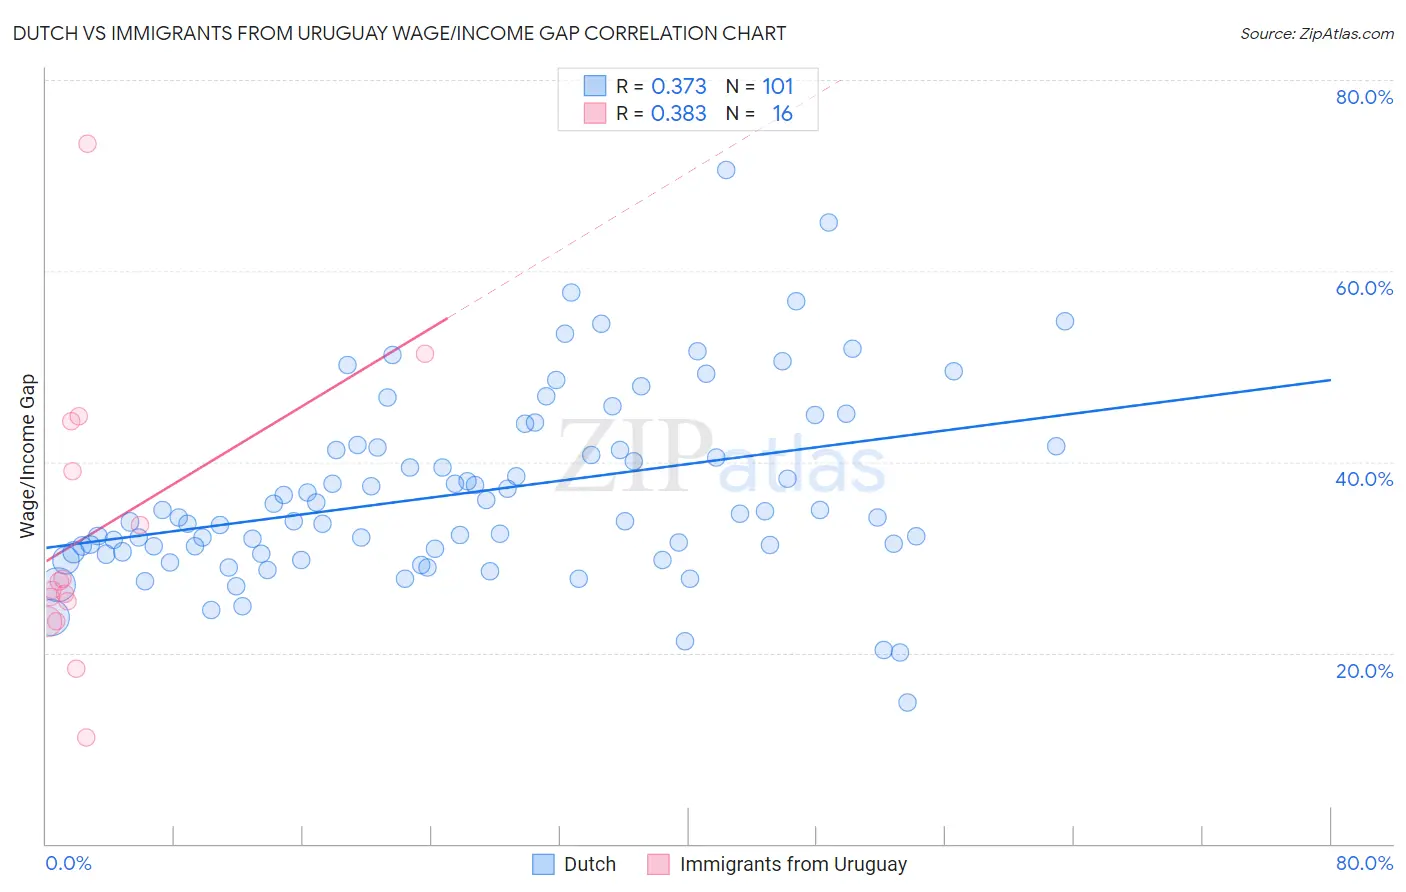
Dutch vs Immigrants from Uruguay Wage/Income Gap Correlation Chart
The statistical analysis conducted on geographies consisting of 552,244,152 people shows a mild positive correlation between the proportion of Dutch and wage/income gap percentage in the United States with a correlation coefficient (R) of 0.373 and weighted average of 29.6%. Similarly, the statistical analysis conducted on geographies consisting of 133,243,894 people shows a mild positive correlation between the proportion of Immigrants from Uruguay and wage/income gap percentage in the United States with a correlation coefficient (R) of 0.383 and weighted average of 24.6%, a difference of 20.3%.
Wage/Income Gap Correlation Summary
| Measurement | Dutch | Immigrants from Uruguay |
| Minimum | 14.8% | 11.1% |
| Maximum | 70.6% | 73.3% |
| Range | 55.8% | 62.2% |
| Mean | 36.8% | 32.6% |
| Median | 34.2% | 27.1% |
| Interquartile 25% (IQ1) | 30.6% | 24.3% |
| Interquartile 75% (IQ3) | 41.5% | 41.7% |
| Interquartile Range (IQR) | 11.0% | 17.3% |
| Standard Deviation (Sample) | 9.7% | 15.1% |
| Standard Deviation (Population) | 9.7% | 14.6% |
Similar Demographics by Wage/Income Gap
Demographics Similar to Dutch by Wage/Income Gap
In terms of wage/income gap, the demographic groups most similar to Dutch are Filipino (29.7%, a difference of 0.22%), Iranian (29.7%, a difference of 0.28%), English (29.5%, a difference of 0.58%), Immigrants from Taiwan (29.5%, a difference of 0.59%), and Swedish (29.4%, a difference of 0.72%).
| Demographics | Rating | Rank | Wage/Income Gap |
| Germans | 0.0 /100 | #330 | Tragic 29.2% |
| Czechs | 0.0 /100 | #331 | Tragic 29.2% |
| Immigrants | South Central Asia | 0.0 /100 | #332 | Tragic 29.3% |
| Europeans | 0.0 /100 | #333 | Tragic 29.4% |
| Swedes | 0.0 /100 | #334 | Tragic 29.4% |
| Immigrants | Taiwan | 0.0 /100 | #335 | Tragic 29.5% |
| English | 0.0 /100 | #336 | Tragic 29.5% |
| Dutch | 0.0 /100 | #337 | Tragic 29.6% |
| Filipinos | 0.0 /100 | #338 | Tragic 29.7% |
| Iranians | 0.0 /100 | #339 | Tragic 29.7% |
| Swiss | 0.0 /100 | #340 | Tragic 30.0% |
| Thais | 0.0 /100 | #341 | Tragic 30.5% |
| Pennsylvania Germans | 0.0 /100 | #342 | Tragic 30.7% |
| Danes | 0.0 /100 | #343 | Tragic 31.0% |
| Assyrians/Chaldeans/Syriacs | 0.0 /100 | #344 | Tragic 31.0% |
Demographics Similar to Immigrants from Uruguay by Wage/Income Gap
In terms of wage/income gap, the demographic groups most similar to Immigrants from Uruguay are German Russian (24.6%, a difference of 0.010%), Spanish American (24.6%, a difference of 0.020%), Immigrants from South America (24.6%, a difference of 0.040%), Immigrants from Central America (24.6%, a difference of 0.070%), and Yup'ik (24.7%, a difference of 0.13%).
| Demographics | Rating | Rank | Wage/Income Gap |
| Kenyans | 95.8 /100 | #119 | Exceptional 24.5% |
| Cree | 95.6 /100 | #120 | Exceptional 24.5% |
| Immigrants | Thailand | 94.9 /100 | #121 | Exceptional 24.5% |
| Apache | 94.8 /100 | #122 | Exceptional 24.5% |
| Natives/Alaskans | 94.6 /100 | #123 | Exceptional 24.6% |
| Immigrants | South America | 93.9 /100 | #124 | Exceptional 24.6% |
| Spanish Americans | 93.8 /100 | #125 | Exceptional 24.6% |
| Immigrants | Uruguay | 93.8 /100 | #126 | Exceptional 24.6% |
| German Russians | 93.7 /100 | #127 | Exceptional 24.6% |
| Immigrants | Central America | 93.5 /100 | #128 | Exceptional 24.6% |
| Yup'ik | 93.3 /100 | #129 | Exceptional 24.7% |
| Alsatians | 93.2 /100 | #130 | Exceptional 24.7% |
| Immigrants | Philippines | 93.0 /100 | #131 | Exceptional 24.7% |
| Immigrants | Costa Rica | 92.4 /100 | #132 | Exceptional 24.7% |
| Colombians | 92.4 /100 | #133 | Exceptional 24.7% |