Greek vs Immigrants from Uruguay Wage/Income Gap
COMPARE
Greek
Immigrants from Uruguay
Wage/Income Gap
Wage/Income Gap Comparison
Greeks
Immigrants from Uruguay
28.2%
WAGE/INCOME GAP
0.3/ 100
METRIC RATING
294th/ 347
METRIC RANK
24.6%
WAGE/INCOME GAP
93.8/ 100
METRIC RATING
126th/ 347
METRIC RANK
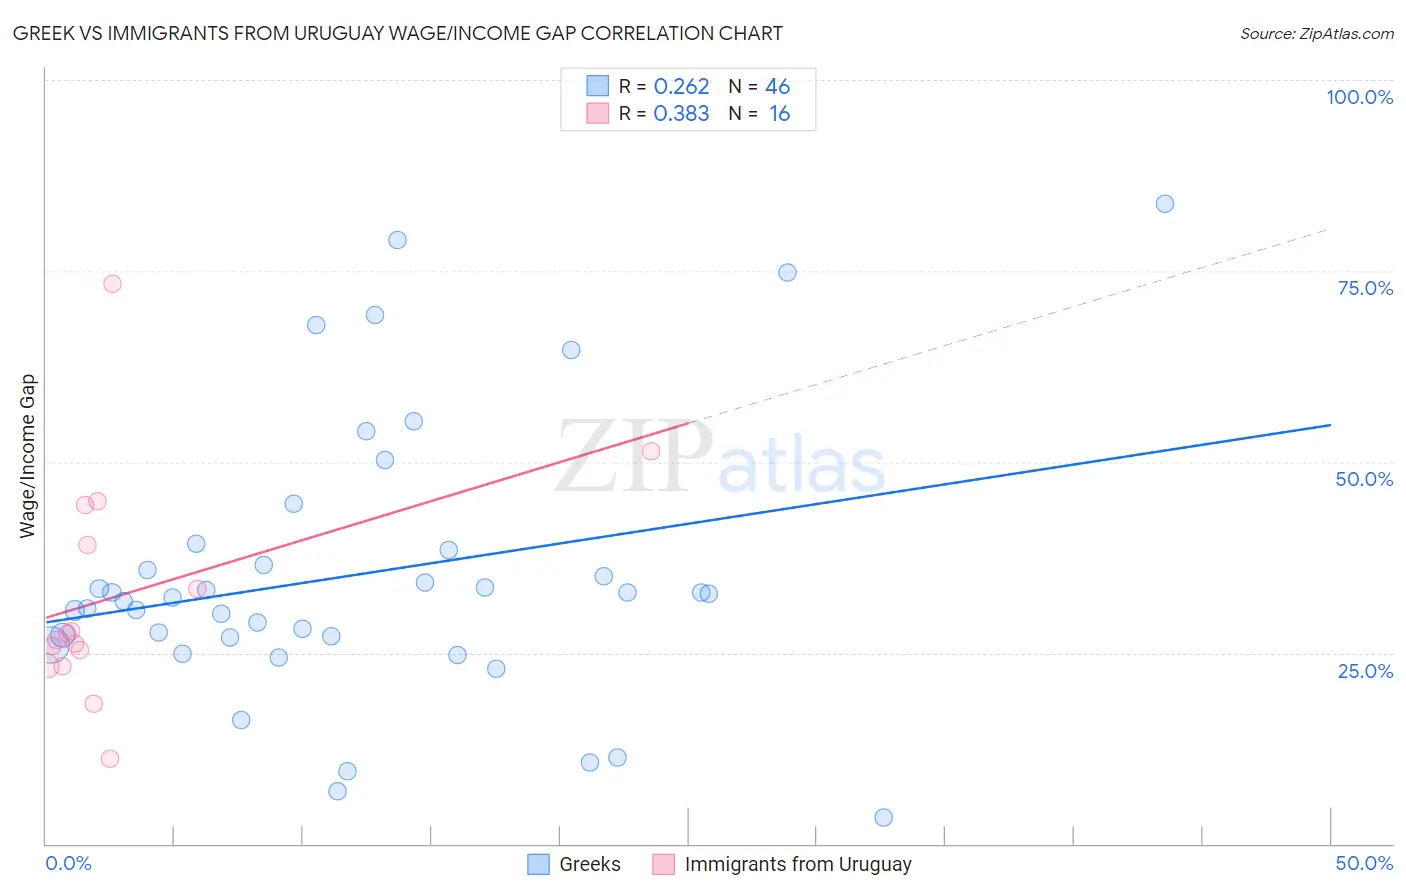
Greek vs Immigrants from Uruguay Wage/Income Gap Correlation Chart
The statistical analysis conducted on geographies consisting of 482,094,899 people shows a weak positive correlation between the proportion of Greeks and wage/income gap percentage in the United States with a correlation coefficient (R) of 0.262 and weighted average of 28.2%. Similarly, the statistical analysis conducted on geographies consisting of 133,243,894 people shows a mild positive correlation between the proportion of Immigrants from Uruguay and wage/income gap percentage in the United States with a correlation coefficient (R) of 0.383 and weighted average of 24.6%, a difference of 14.7%.
Wage/Income Gap Correlation Summary
| Measurement | Greek | Immigrants from Uruguay |
| Minimum | 3.5% | 11.1% |
| Maximum | 83.8% | 73.3% |
| Range | 80.3% | 62.2% |
| Mean | 35.4% | 32.6% |
| Median | 32.4% | 27.1% |
| Interquartile 25% (IQ1) | 27.0% | 24.3% |
| Interquartile 75% (IQ3) | 38.5% | 41.7% |
| Interquartile Range (IQR) | 11.5% | 17.3% |
| Standard Deviation (Sample) | 18.3% | 15.1% |
| Standard Deviation (Population) | 18.1% | 14.6% |
Similar Demographics by Wage/Income Gap
Demographics Similar to Greeks by Wage/Income Gap
In terms of wage/income gap, the demographic groups most similar to Greeks are Immigrants from Israel (28.2%, a difference of 0.020%), Immigrants from Australia (28.2%, a difference of 0.13%), Slovene (28.3%, a difference of 0.13%), Northern European (28.3%, a difference of 0.13%), and Czechoslovakian (28.2%, a difference of 0.19%).
| Demographics | Rating | Rank | Wage/Income Gap |
| Okinawans | 0.4 /100 | #287 | Tragic 28.1% |
| Choctaw | 0.4 /100 | #288 | Tragic 28.1% |
| Canadians | 0.3 /100 | #289 | Tragic 28.1% |
| Australians | 0.3 /100 | #290 | Tragic 28.2% |
| Czechoslovakians | 0.3 /100 | #291 | Tragic 28.2% |
| Immigrants | Australia | 0.3 /100 | #292 | Tragic 28.2% |
| Immigrants | Israel | 0.3 /100 | #293 | Tragic 28.2% |
| Greeks | 0.3 /100 | #294 | Tragic 28.2% |
| Slovenes | 0.3 /100 | #295 | Tragic 28.3% |
| Northern Europeans | 0.3 /100 | #296 | Tragic 28.3% |
| Immigrants | North America | 0.2 /100 | #297 | Tragic 28.4% |
| Austrians | 0.2 /100 | #298 | Tragic 28.4% |
| Immigrants | North Macedonia | 0.2 /100 | #299 | Tragic 28.4% |
| Immigrants | Northern Europe | 0.2 /100 | #300 | Tragic 28.5% |
| Immigrants | Canada | 0.2 /100 | #301 | Tragic 28.5% |
Demographics Similar to Immigrants from Uruguay by Wage/Income Gap
In terms of wage/income gap, the demographic groups most similar to Immigrants from Uruguay are German Russian (24.6%, a difference of 0.010%), Spanish American (24.6%, a difference of 0.020%), Immigrants from South America (24.6%, a difference of 0.040%), Immigrants from Central America (24.6%, a difference of 0.070%), and Yup'ik (24.7%, a difference of 0.13%).
| Demographics | Rating | Rank | Wage/Income Gap |
| Kenyans | 95.8 /100 | #119 | Exceptional 24.5% |
| Cree | 95.6 /100 | #120 | Exceptional 24.5% |
| Immigrants | Thailand | 94.9 /100 | #121 | Exceptional 24.5% |
| Apache | 94.8 /100 | #122 | Exceptional 24.5% |
| Natives/Alaskans | 94.6 /100 | #123 | Exceptional 24.6% |
| Immigrants | South America | 93.9 /100 | #124 | Exceptional 24.6% |
| Spanish Americans | 93.8 /100 | #125 | Exceptional 24.6% |
| Immigrants | Uruguay | 93.8 /100 | #126 | Exceptional 24.6% |
| German Russians | 93.7 /100 | #127 | Exceptional 24.6% |
| Immigrants | Central America | 93.5 /100 | #128 | Exceptional 24.6% |
| Yup'ik | 93.3 /100 | #129 | Exceptional 24.7% |
| Alsatians | 93.2 /100 | #130 | Exceptional 24.7% |
| Immigrants | Philippines | 93.0 /100 | #131 | Exceptional 24.7% |
| Immigrants | Costa Rica | 92.4 /100 | #132 | Exceptional 24.7% |
| Colombians | 92.4 /100 | #133 | Exceptional 24.7% |