Bhutanese vs Immigrants from Egypt Median Male Earnings
COMPARE
Bhutanese
Immigrants from Egypt
Median Male Earnings
Median Male Earnings Comparison
Bhutanese
Immigrants from Egypt
$61,759
MEDIAN MALE EARNINGS
99.9/ 100
METRIC RATING
50th/ 347
METRIC RANK
$59,925
MEDIAN MALE EARNINGS
99.5/ 100
METRIC RATING
78th/ 347
METRIC RANK
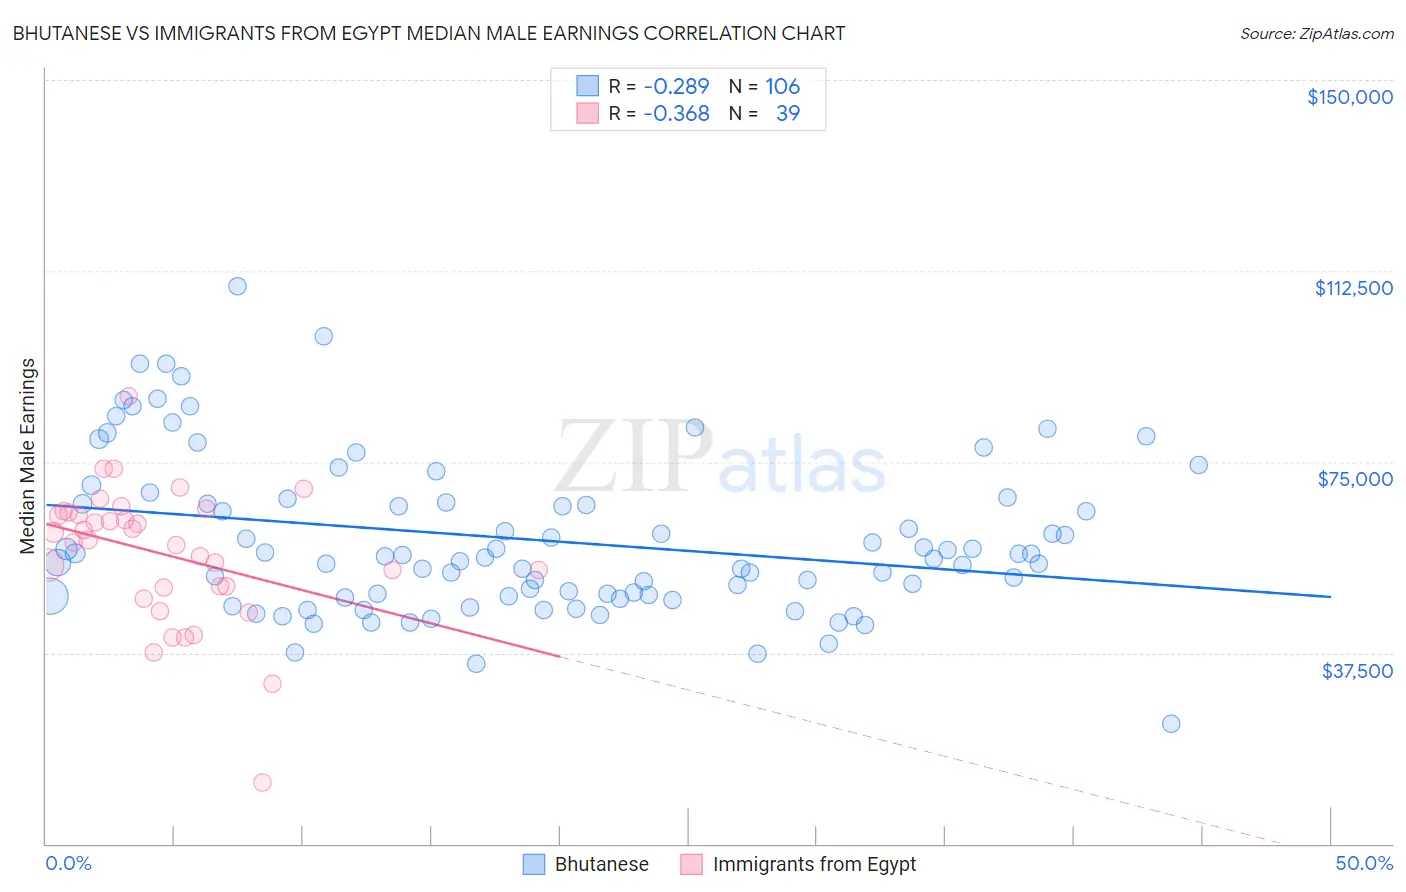
Bhutanese vs Immigrants from Egypt Median Male Earnings Correlation Chart
The statistical analysis conducted on geographies consisting of 455,387,679 people shows a weak negative correlation between the proportion of Bhutanese and median male earnings in the United States with a correlation coefficient (R) of -0.289 and weighted average of $61,759. Similarly, the statistical analysis conducted on geographies consisting of 245,462,607 people shows a mild negative correlation between the proportion of Immigrants from Egypt and median male earnings in the United States with a correlation coefficient (R) of -0.368 and weighted average of $59,925, a difference of 3.1%.
Median Male Earnings Correlation Summary
| Measurement | Bhutanese | Immigrants from Egypt |
| Minimum | $23,594 | $12,000 |
| Maximum | $109,392 | $87,885 |
| Range | $85,798 | $75,885 |
| Mean | $59,697 | $56,843 |
| Median | $56,402 | $59,590 |
| Interquartile 25% (IQ1) | $48,730 | $50,375 |
| Interquartile 75% (IQ3) | $67,058 | $64,984 |
| Interquartile Range (IQR) | $18,327 | $14,609 |
| Standard Deviation (Sample) | $15,498 | $13,509 |
| Standard Deviation (Population) | $15,425 | $13,335 |
Similar Demographics by Median Male Earnings
Demographics Similar to Bhutanese by Median Male Earnings
In terms of median male earnings, the demographic groups most similar to Bhutanese are Estonian ($61,710, a difference of 0.080%), Immigrants from Norway ($61,628, a difference of 0.21%), Immigrants from Europe ($62,057, a difference of 0.48%), South African ($61,460, a difference of 0.49%), and Immigrants from Latvia ($61,422, a difference of 0.55%).
| Demographics | Rating | Rank | Median Male Earnings |
| Immigrants | Belarus | 100.0 /100 | #43 | Exceptional $62,658 |
| Cambodians | 100.0 /100 | #44 | Exceptional $62,516 |
| Bulgarians | 100.0 /100 | #45 | Exceptional $62,378 |
| Immigrants | Czechoslovakia | 99.9 /100 | #46 | Exceptional $62,217 |
| Immigrants | Austria | 99.9 /100 | #47 | Exceptional $62,164 |
| Immigrants | Malaysia | 99.9 /100 | #48 | Exceptional $62,121 |
| Immigrants | Europe | 99.9 /100 | #49 | Exceptional $62,057 |
| Bhutanese | 99.9 /100 | #50 | Exceptional $61,759 |
| Estonians | 99.9 /100 | #51 | Exceptional $61,710 |
| Immigrants | Norway | 99.9 /100 | #52 | Exceptional $61,628 |
| South Africans | 99.9 /100 | #53 | Exceptional $61,460 |
| Immigrants | Latvia | 99.9 /100 | #54 | Exceptional $61,422 |
| Greeks | 99.9 /100 | #55 | Exceptional $61,242 |
| Lithuanians | 99.9 /100 | #56 | Exceptional $61,228 |
| Immigrants | Scotland | 99.9 /100 | #57 | Exceptional $61,220 |
Demographics Similar to Immigrants from Egypt by Median Male Earnings
In terms of median male earnings, the demographic groups most similar to Immigrants from Egypt are Paraguayan ($59,975, a difference of 0.080%), Immigrants from Ukraine ($59,820, a difference of 0.18%), Immigrants from Hungary ($59,806, a difference of 0.20%), Romanian ($60,063, a difference of 0.23%), and Immigrants from Bolivia ($60,088, a difference of 0.27%).
| Demographics | Rating | Rank | Median Male Earnings |
| Mongolians | 99.7 /100 | #71 | Exceptional $60,350 |
| Immigrants | Western Europe | 99.7 /100 | #72 | Exceptional $60,334 |
| Immigrants | North America | 99.7 /100 | #73 | Exceptional $60,265 |
| Argentineans | 99.6 /100 | #74 | Exceptional $60,117 |
| Immigrants | Bolivia | 99.6 /100 | #75 | Exceptional $60,088 |
| Romanians | 99.6 /100 | #76 | Exceptional $60,063 |
| Paraguayans | 99.5 /100 | #77 | Exceptional $59,975 |
| Immigrants | Egypt | 99.5 /100 | #78 | Exceptional $59,925 |
| Immigrants | Ukraine | 99.5 /100 | #79 | Exceptional $59,820 |
| Immigrants | Hungary | 99.5 /100 | #80 | Exceptional $59,806 |
| Ukrainians | 99.4 /100 | #81 | Exceptional $59,728 |
| Croatians | 99.4 /100 | #82 | Exceptional $59,715 |
| Immigrants | Italy | 99.4 /100 | #83 | Exceptional $59,691 |
| Afghans | 99.3 /100 | #84 | Exceptional $59,554 |
| Italians | 99.3 /100 | #85 | Exceptional $59,551 |