Native Hawaiian vs Icelander Median Male Earnings
COMPARE
Native Hawaiian
Icelander
Median Male Earnings
Median Male Earnings Comparison
Native Hawaiians
Icelanders
$52,306
MEDIAN MALE EARNINGS
10.5/ 100
METRIC RATING
213th/ 347
METRIC RANK
$55,415
MEDIAN MALE EARNINGS
71.2/ 100
METRIC RATING
157th/ 347
METRIC RANK
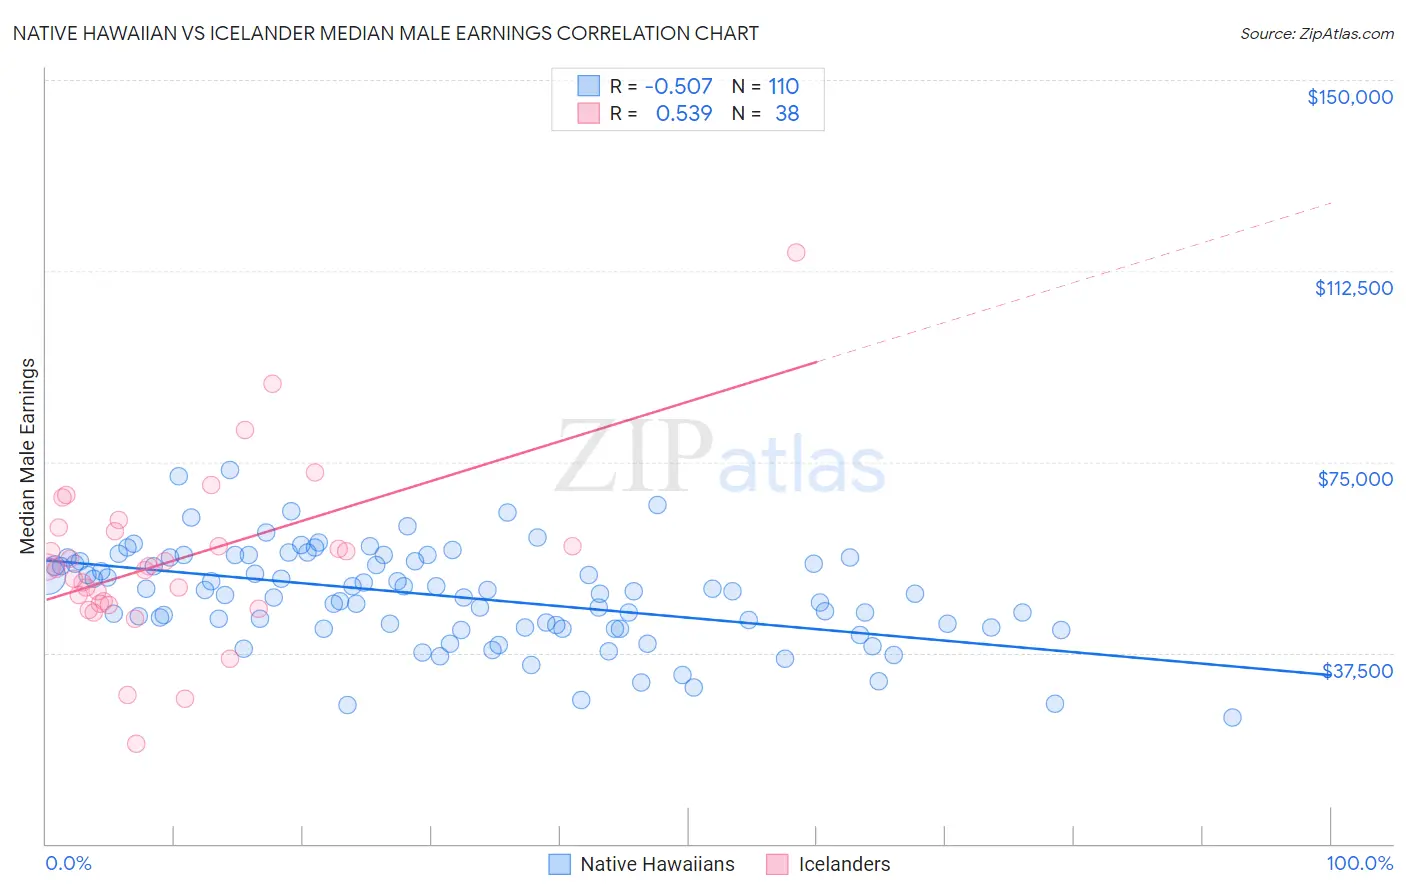
Native Hawaiian vs Icelander Median Male Earnings Correlation Chart
The statistical analysis conducted on geographies consisting of 332,009,259 people shows a substantial negative correlation between the proportion of Native Hawaiians and median male earnings in the United States with a correlation coefficient (R) of -0.507 and weighted average of $52,306. Similarly, the statistical analysis conducted on geographies consisting of 159,653,287 people shows a substantial positive correlation between the proportion of Icelanders and median male earnings in the United States with a correlation coefficient (R) of 0.539 and weighted average of $55,415, a difference of 5.9%.
Median Male Earnings Correlation Summary
| Measurement | Native Hawaiian | Icelander |
| Minimum | $24,830 | $19,583 |
| Maximum | $73,412 | $116,188 |
| Range | $48,582 | $96,605 |
| Mean | $48,621 | $55,596 |
| Median | $49,328 | $54,221 |
| Interquartile 25% (IQ1) | $42,387 | $47,034 |
| Interquartile 75% (IQ3) | $55,422 | $61,435 |
| Interquartile Range (IQR) | $13,035 | $14,401 |
| Standard Deviation (Sample) | $9,458 | $16,814 |
| Standard Deviation (Population) | $9,414 | $16,591 |
Similar Demographics by Median Male Earnings
Demographics Similar to Native Hawaiians by Median Male Earnings
In terms of median male earnings, the demographic groups most similar to Native Hawaiians are Cajun ($52,325, a difference of 0.040%), Delaware ($52,412, a difference of 0.20%), Tlingit-Haida ($52,409, a difference of 0.20%), Nonimmigrants ($52,170, a difference of 0.26%), and Bermudan ($52,465, a difference of 0.30%).
| Demographics | Rating | Rank | Median Male Earnings |
| Immigrants | Iraq | 14.5 /100 | #206 | Poor $52,681 |
| Vietnamese | 12.7 /100 | #207 | Poor $52,525 |
| Venezuelans | 12.5 /100 | #208 | Poor $52,510 |
| Bermudans | 12.1 /100 | #209 | Poor $52,465 |
| Delaware | 11.5 /100 | #210 | Poor $52,412 |
| Tlingit-Haida | 11.5 /100 | #211 | Poor $52,409 |
| Cajuns | 10.7 /100 | #212 | Poor $52,325 |
| Native Hawaiians | 10.5 /100 | #213 | Poor $52,306 |
| Immigrants | Nonimmigrants | 9.3 /100 | #214 | Tragic $52,170 |
| Immigrants | Cameroon | 8.9 /100 | #215 | Tragic $52,119 |
| Immigrants | Venezuela | 8.3 /100 | #216 | Tragic $52,041 |
| Nigerians | 8.3 /100 | #217 | Tragic $52,039 |
| Immigrants | Panama | 7.7 /100 | #218 | Tragic $51,962 |
| Immigrants | Ghana | 6.9 /100 | #219 | Tragic $51,836 |
| Immigrants | Armenia | 6.6 /100 | #220 | Tragic $51,793 |
Demographics Similar to Icelanders by Median Male Earnings
In terms of median male earnings, the demographic groups most similar to Icelanders are Immigrants from Ethiopia ($55,434, a difference of 0.030%), Czechoslovakian ($55,382, a difference of 0.060%), Alsatian ($55,380, a difference of 0.060%), Basque ($55,370, a difference of 0.080%), and Belgian ($55,361, a difference of 0.10%).
| Demographics | Rating | Rank | Median Male Earnings |
| Swiss | 77.1 /100 | #150 | Good $55,731 |
| Immigrants | Oceania | 76.8 /100 | #151 | Good $55,712 |
| Peruvians | 75.8 /100 | #152 | Good $55,659 |
| Immigrants | Nepal | 75.0 /100 | #153 | Good $55,615 |
| Taiwanese | 73.9 /100 | #154 | Good $55,556 |
| Scandinavians | 73.4 /100 | #155 | Good $55,527 |
| Immigrants | Ethiopia | 71.6 /100 | #156 | Good $55,434 |
| Icelanders | 71.2 /100 | #157 | Good $55,415 |
| Czechoslovakians | 70.5 /100 | #158 | Good $55,382 |
| Alsatians | 70.5 /100 | #159 | Good $55,380 |
| Basques | 70.3 /100 | #160 | Good $55,370 |
| Belgians | 70.1 /100 | #161 | Good $55,361 |
| French | 69.9 /100 | #162 | Good $55,350 |
| Ugandans | 68.6 /100 | #163 | Good $55,290 |
| Immigrants | South Eastern Asia | 67.6 /100 | #164 | Good $55,241 |