Kenyan vs Immigrants from Mexico Per Capita Income
COMPARE
Kenyan
Immigrants from Mexico
Per Capita Income
Per Capita Income Comparison
Kenyans
Immigrants from Mexico
$42,808
PER CAPITA INCOME
27.7/ 100
METRIC RATING
190th/ 347
METRIC RANK
$33,931
PER CAPITA INCOME
0.0/ 100
METRIC RATING
331st/ 347
METRIC RANK
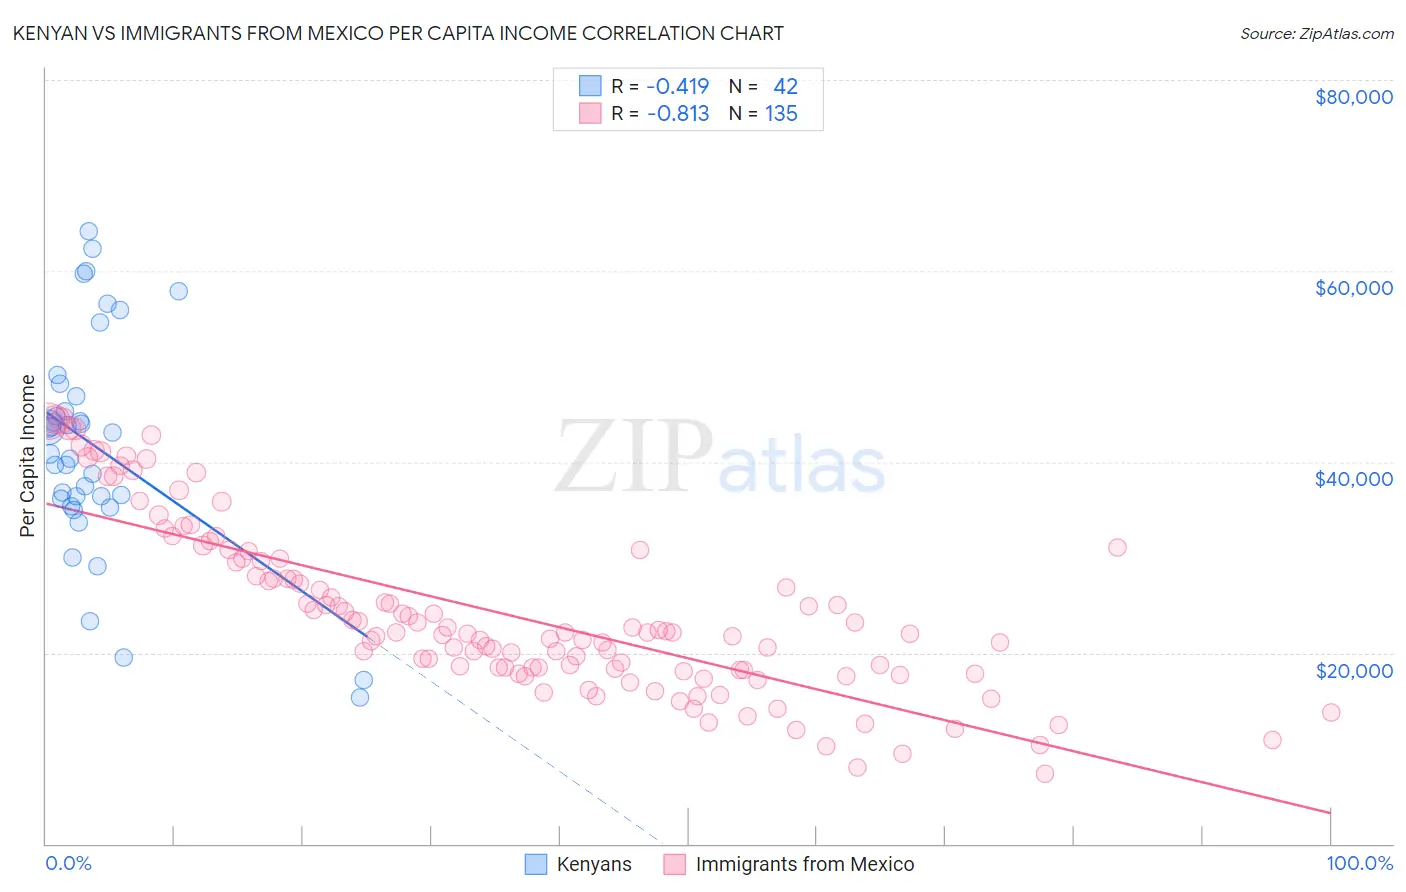
Kenyan vs Immigrants from Mexico Per Capita Income Correlation Chart
The statistical analysis conducted on geographies consisting of 168,245,574 people shows a moderate negative correlation between the proportion of Kenyans and per capita income in the United States with a correlation coefficient (R) of -0.419 and weighted average of $42,808. Similarly, the statistical analysis conducted on geographies consisting of 513,776,249 people shows a very strong negative correlation between the proportion of Immigrants from Mexico and per capita income in the United States with a correlation coefficient (R) of -0.813 and weighted average of $33,931, a difference of 26.2%.
Per Capita Income Correlation Summary
| Measurement | Kenyan | Immigrants from Mexico |
| Minimum | $15,366 | $7,365 |
| Maximum | $64,188 | $44,424 |
| Range | $48,822 | $37,059 |
| Mean | $41,624 | $24,192 |
| Median | $42,003 | $22,163 |
| Interquartile 25% (IQ1) | $36,158 | $18,195 |
| Interquartile 75% (IQ3) | $46,865 | $29,815 |
| Interquartile Range (IQR) | $10,707 | $11,620 |
| Standard Deviation (Sample) | $11,486 | $8,892 |
| Standard Deviation (Population) | $11,348 | $8,859 |
Similar Demographics by Per Capita Income
Demographics Similar to Kenyans by Per Capita Income
In terms of per capita income, the demographic groups most similar to Kenyans are Yugoslavian ($42,792, a difference of 0.040%), Iraqi ($42,760, a difference of 0.11%), Immigrants from Sierra Leone ($42,752, a difference of 0.13%), Bermudan ($42,911, a difference of 0.24%), and Immigrants from Fiji ($42,694, a difference of 0.27%).
| Demographics | Rating | Rank | Per Capita Income |
| Germans | 33.9 /100 | #183 | Fair $43,067 |
| Spaniards | 32.9 /100 | #184 | Fair $43,028 |
| Immigrants | Immigrants | 32.5 /100 | #185 | Fair $43,010 |
| French Canadians | 32.3 /100 | #186 | Fair $43,003 |
| Immigrants | Colombia | 31.5 /100 | #187 | Fair $42,971 |
| Immigrants | Africa | 31.0 /100 | #188 | Fair $42,950 |
| Bermudans | 30.1 /100 | #189 | Fair $42,911 |
| Kenyans | 27.7 /100 | #190 | Fair $42,808 |
| Yugoslavians | 27.4 /100 | #191 | Fair $42,792 |
| Iraqis | 26.7 /100 | #192 | Fair $42,760 |
| Immigrants | Sierra Leone | 26.5 /100 | #193 | Fair $42,752 |
| Immigrants | Fiji | 25.2 /100 | #194 | Fair $42,694 |
| Immigrants | Kenya | 24.5 /100 | #195 | Fair $42,661 |
| Dutch | 23.4 /100 | #196 | Fair $42,605 |
| Scotch-Irish | 22.6 /100 | #197 | Fair $42,563 |
Demographics Similar to Immigrants from Mexico by Per Capita Income
In terms of per capita income, the demographic groups most similar to Immigrants from Mexico are Sioux ($33,921, a difference of 0.030%), Immigrants from Yemen ($33,696, a difference of 0.70%), Spanish American Indian ($34,195, a difference of 0.78%), Mexican ($34,559, a difference of 1.8%), and Menominee ($34,578, a difference of 1.9%).
| Demographics | Rating | Rank | Per Capita Income |
| Kiowa | 0.0 /100 | #324 | Tragic $35,102 |
| Immigrants | Central America | 0.0 /100 | #325 | Tragic $34,974 |
| Immigrants | Cuba | 0.0 /100 | #326 | Tragic $34,910 |
| Apache | 0.0 /100 | #327 | Tragic $34,886 |
| Menominee | 0.0 /100 | #328 | Tragic $34,578 |
| Mexicans | 0.0 /100 | #329 | Tragic $34,559 |
| Spanish American Indians | 0.0 /100 | #330 | Tragic $34,195 |
| Immigrants | Mexico | 0.0 /100 | #331 | Tragic $33,931 |
| Sioux | 0.0 /100 | #332 | Tragic $33,921 |
| Immigrants | Yemen | 0.0 /100 | #333 | Tragic $33,696 |
| Natives/Alaskans | 0.0 /100 | #334 | Tragic $33,279 |
| Yuman | 0.0 /100 | #335 | Tragic $33,236 |
| Yakama | 0.0 /100 | #336 | Tragic $33,009 |
| Houma | 0.0 /100 | #337 | Tragic $32,996 |
| Arapaho | 0.0 /100 | #338 | Tragic $32,345 |