Kenyan vs Assyrian/Chaldean/Syriac Per Capita Income
COMPARE
Kenyan
Assyrian/Chaldean/Syriac
Per Capita Income
Per Capita Income Comparison
Kenyans
Assyrians/Chaldeans/Syriacs
$42,808
PER CAPITA INCOME
27.7/ 100
METRIC RATING
190th/ 347
METRIC RANK
$45,195
PER CAPITA INCOME
84.8/ 100
METRIC RATING
138th/ 347
METRIC RANK
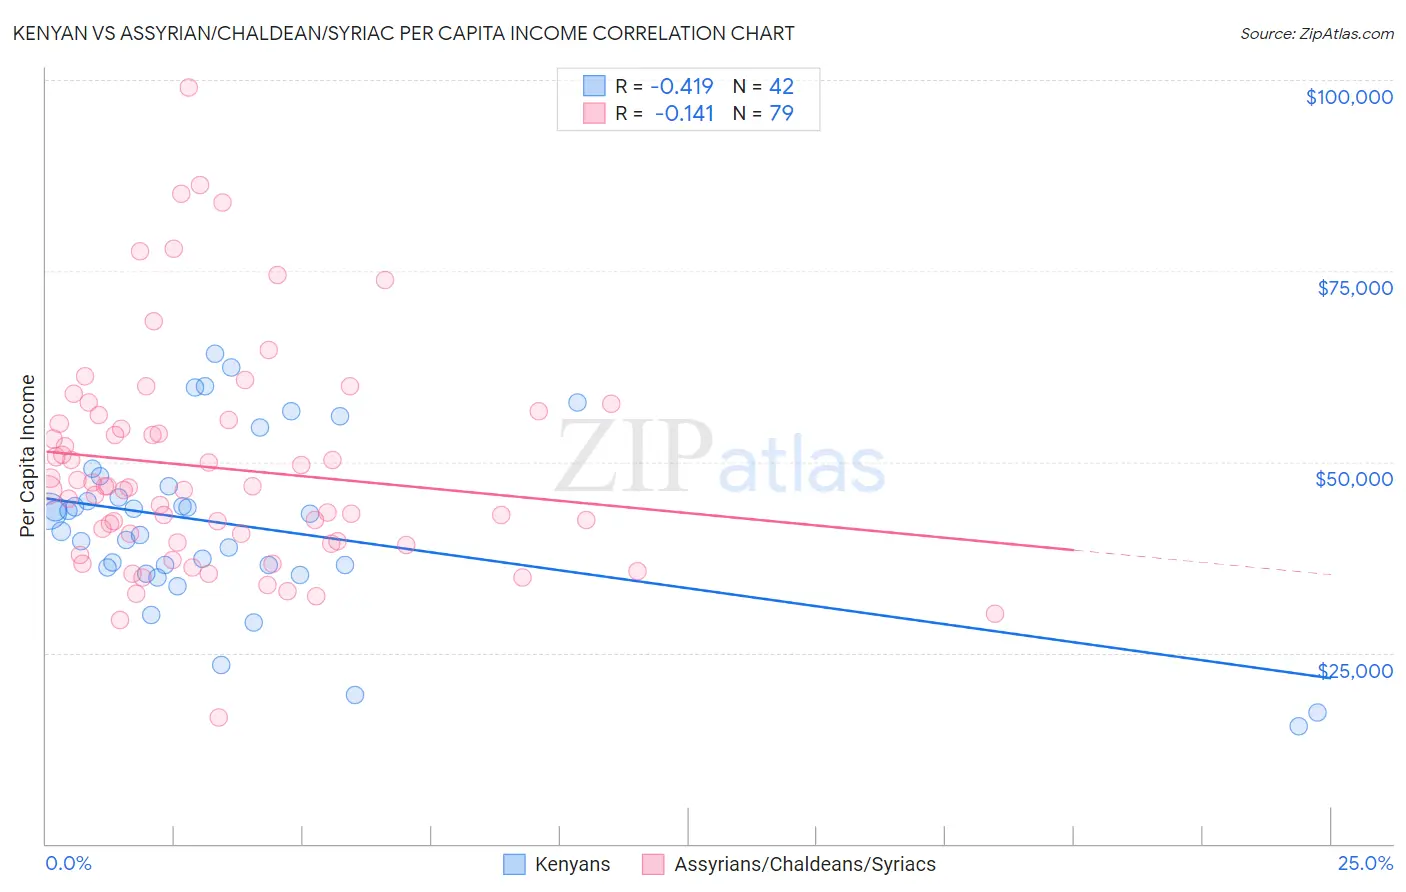
Kenyan vs Assyrian/Chaldean/Syriac Per Capita Income Correlation Chart
The statistical analysis conducted on geographies consisting of 168,245,574 people shows a moderate negative correlation between the proportion of Kenyans and per capita income in the United States with a correlation coefficient (R) of -0.419 and weighted average of $42,808. Similarly, the statistical analysis conducted on geographies consisting of 110,311,560 people shows a poor negative correlation between the proportion of Assyrians/Chaldeans/Syriacs and per capita income in the United States with a correlation coefficient (R) of -0.141 and weighted average of $45,195, a difference of 5.6%.
Per Capita Income Correlation Summary
| Measurement | Kenyan | Assyrian/Chaldean/Syriac |
| Minimum | $15,366 | $16,468 |
| Maximum | $64,188 | $99,080 |
| Range | $48,822 | $82,612 |
| Mean | $41,624 | $49,218 |
| Median | $42,003 | $46,715 |
| Interquartile 25% (IQ1) | $36,158 | $39,451 |
| Interquartile 75% (IQ3) | $46,865 | $55,554 |
| Interquartile Range (IQR) | $10,707 | $16,103 |
| Standard Deviation (Sample) | $11,486 | $14,590 |
| Standard Deviation (Population) | $11,348 | $14,497 |
Similar Demographics by Per Capita Income
Demographics Similar to Kenyans by Per Capita Income
In terms of per capita income, the demographic groups most similar to Kenyans are Yugoslavian ($42,792, a difference of 0.040%), Iraqi ($42,760, a difference of 0.11%), Immigrants from Sierra Leone ($42,752, a difference of 0.13%), Bermudan ($42,911, a difference of 0.24%), and Immigrants from Fiji ($42,694, a difference of 0.27%).
| Demographics | Rating | Rank | Per Capita Income |
| Germans | 33.9 /100 | #183 | Fair $43,067 |
| Spaniards | 32.9 /100 | #184 | Fair $43,028 |
| Immigrants | Immigrants | 32.5 /100 | #185 | Fair $43,010 |
| French Canadians | 32.3 /100 | #186 | Fair $43,003 |
| Immigrants | Colombia | 31.5 /100 | #187 | Fair $42,971 |
| Immigrants | Africa | 31.0 /100 | #188 | Fair $42,950 |
| Bermudans | 30.1 /100 | #189 | Fair $42,911 |
| Kenyans | 27.7 /100 | #190 | Fair $42,808 |
| Yugoslavians | 27.4 /100 | #191 | Fair $42,792 |
| Iraqis | 26.7 /100 | #192 | Fair $42,760 |
| Immigrants | Sierra Leone | 26.5 /100 | #193 | Fair $42,752 |
| Immigrants | Fiji | 25.2 /100 | #194 | Fair $42,694 |
| Immigrants | Kenya | 24.5 /100 | #195 | Fair $42,661 |
| Dutch | 23.4 /100 | #196 | Fair $42,605 |
| Scotch-Irish | 22.6 /100 | #197 | Fair $42,563 |
Demographics Similar to Assyrians/Chaldeans/Syriacs by Per Capita Income
In terms of per capita income, the demographic groups most similar to Assyrians/Chaldeans/Syriacs are Immigrants from Syria ($45,218, a difference of 0.050%), Immigrants from Oceania ($45,220, a difference of 0.060%), Basque ($45,086, a difference of 0.24%), Immigrants from Jordan ($45,066, a difference of 0.29%), and Slavic ($45,049, a difference of 0.32%).
| Demographics | Rating | Rank | Per Capita Income |
| Immigrants | North Macedonia | 90.0 /100 | #131 | Exceptional $45,622 |
| Jordanians | 89.9 /100 | #132 | Excellent $45,605 |
| Pakistanis | 89.7 /100 | #133 | Excellent $45,587 |
| Slovenes | 89.6 /100 | #134 | Excellent $45,581 |
| Hungarians | 87.9 /100 | #135 | Excellent $45,426 |
| Immigrants | Oceania | 85.2 /100 | #136 | Excellent $45,220 |
| Immigrants | Syria | 85.2 /100 | #137 | Excellent $45,218 |
| Assyrians/Chaldeans/Syriacs | 84.8 /100 | #138 | Excellent $45,195 |
| Basques | 83.2 /100 | #139 | Excellent $45,086 |
| Immigrants | Jordan | 82.9 /100 | #140 | Excellent $45,066 |
| Slavs | 82.6 /100 | #141 | Excellent $45,049 |
| Ugandans | 82.6 /100 | #142 | Excellent $45,047 |
| Immigrants | Uganda | 82.5 /100 | #143 | Excellent $45,043 |
| Icelanders | 81.6 /100 | #144 | Excellent $44,987 |
| Immigrants | Afghanistan | 78.0 /100 | #145 | Good $44,790 |