Kenyan vs New Zealander Per Capita Income
COMPARE
Kenyan
New Zealander
Per Capita Income
Per Capita Income Comparison
Kenyans
New Zealanders
$42,808
PER CAPITA INCOME
27.7/ 100
METRIC RATING
190th/ 347
METRIC RANK
$50,575
PER CAPITA INCOME
100.0/ 100
METRIC RATING
49th/ 347
METRIC RANK
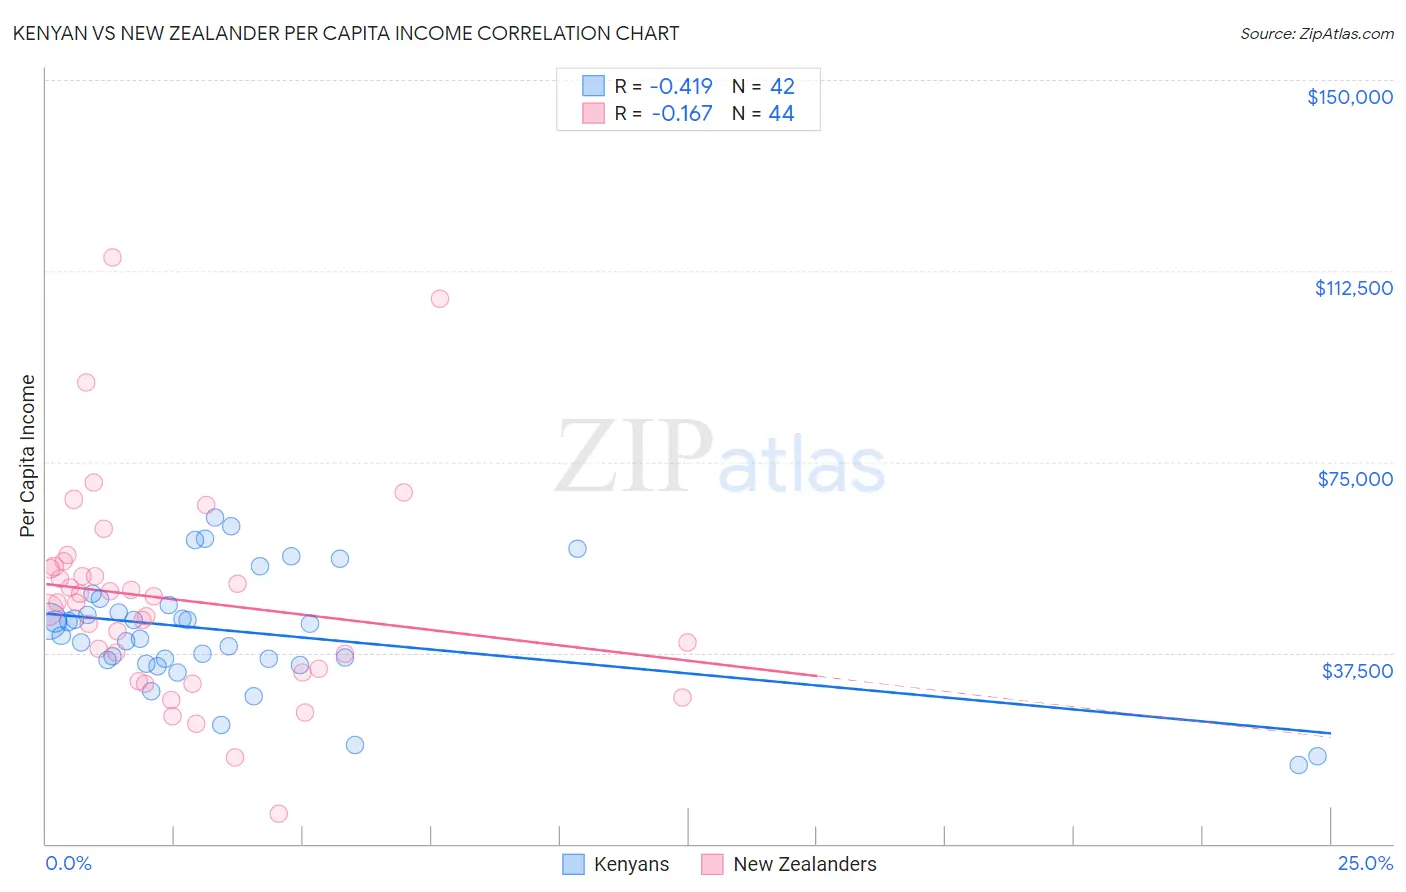
Kenyan vs New Zealander Per Capita Income Correlation Chart
The statistical analysis conducted on geographies consisting of 168,245,574 people shows a moderate negative correlation between the proportion of Kenyans and per capita income in the United States with a correlation coefficient (R) of -0.419 and weighted average of $42,808. Similarly, the statistical analysis conducted on geographies consisting of 106,919,498 people shows a poor negative correlation between the proportion of New Zealanders and per capita income in the United States with a correlation coefficient (R) of -0.167 and weighted average of $50,575, a difference of 18.1%.
Per Capita Income Correlation Summary
| Measurement | Kenyan | New Zealander |
| Minimum | $15,366 | $5,784 |
| Maximum | $64,188 | $115,097 |
| Range | $48,822 | $109,313 |
| Mean | $41,624 | $47,922 |
| Median | $42,003 | $47,389 |
| Interquartile 25% (IQ1) | $36,158 | $34,042 |
| Interquartile 75% (IQ3) | $46,865 | $54,179 |
| Interquartile Range (IQR) | $10,707 | $20,137 |
| Standard Deviation (Sample) | $11,486 | $20,895 |
| Standard Deviation (Population) | $11,348 | $20,656 |
Similar Demographics by Per Capita Income
Demographics Similar to Kenyans by Per Capita Income
In terms of per capita income, the demographic groups most similar to Kenyans are Yugoslavian ($42,792, a difference of 0.040%), Iraqi ($42,760, a difference of 0.11%), Immigrants from Sierra Leone ($42,752, a difference of 0.13%), Bermudan ($42,911, a difference of 0.24%), and Immigrants from Fiji ($42,694, a difference of 0.27%).
| Demographics | Rating | Rank | Per Capita Income |
| Germans | 33.9 /100 | #183 | Fair $43,067 |
| Spaniards | 32.9 /100 | #184 | Fair $43,028 |
| Immigrants | Immigrants | 32.5 /100 | #185 | Fair $43,010 |
| French Canadians | 32.3 /100 | #186 | Fair $43,003 |
| Immigrants | Colombia | 31.5 /100 | #187 | Fair $42,971 |
| Immigrants | Africa | 31.0 /100 | #188 | Fair $42,950 |
| Bermudans | 30.1 /100 | #189 | Fair $42,911 |
| Kenyans | 27.7 /100 | #190 | Fair $42,808 |
| Yugoslavians | 27.4 /100 | #191 | Fair $42,792 |
| Iraqis | 26.7 /100 | #192 | Fair $42,760 |
| Immigrants | Sierra Leone | 26.5 /100 | #193 | Fair $42,752 |
| Immigrants | Fiji | 25.2 /100 | #194 | Fair $42,694 |
| Immigrants | Kenya | 24.5 /100 | #195 | Fair $42,661 |
| Dutch | 23.4 /100 | #196 | Fair $42,605 |
| Scotch-Irish | 22.6 /100 | #197 | Fair $42,563 |
Demographics Similar to New Zealanders by Per Capita Income
In terms of per capita income, the demographic groups most similar to New Zealanders are Immigrants from Sri Lanka ($50,555, a difference of 0.040%), Immigrants from Netherlands ($50,458, a difference of 0.23%), Immigrants from Croatia ($50,417, a difference of 0.31%), Paraguayan ($50,385, a difference of 0.38%), and Immigrants from Serbia ($50,810, a difference of 0.46%).
| Demographics | Rating | Rank | Per Capita Income |
| Immigrants | Turkey | 100.0 /100 | #42 | Exceptional $51,368 |
| Immigrants | Lithuania | 100.0 /100 | #43 | Exceptional $51,361 |
| Immigrants | Europe | 100.0 /100 | #44 | Exceptional $50,950 |
| Immigrants | Spain | 100.0 /100 | #45 | Exceptional $50,933 |
| Immigrants | Latvia | 100.0 /100 | #46 | Exceptional $50,914 |
| Bulgarians | 100.0 /100 | #47 | Exceptional $50,906 |
| Immigrants | Serbia | 100.0 /100 | #48 | Exceptional $50,810 |
| New Zealanders | 100.0 /100 | #49 | Exceptional $50,575 |
| Immigrants | Sri Lanka | 100.0 /100 | #50 | Exceptional $50,555 |
| Immigrants | Netherlands | 100.0 /100 | #51 | Exceptional $50,458 |
| Immigrants | Croatia | 99.9 /100 | #52 | Exceptional $50,417 |
| Paraguayans | 99.9 /100 | #53 | Exceptional $50,385 |
| Immigrants | Belarus | 99.9 /100 | #54 | Exceptional $50,303 |
| Immigrants | Western Europe | 99.9 /100 | #55 | Exceptional $50,065 |
| Asians | 99.9 /100 | #56 | Exceptional $50,057 |