Jordanian vs Blackfeet Median Household Income
COMPARE
Jordanian
Blackfeet
Median Household Income
Median Household Income Comparison
Jordanians
Blackfeet
$91,794
MEDIAN HOUSEHOLD INCOME
98.7/ 100
METRIC RATING
96th/ 347
METRIC RANK
$73,509
MEDIAN HOUSEHOLD INCOME
0.1/ 100
METRIC RATING
294th/ 347
METRIC RANK
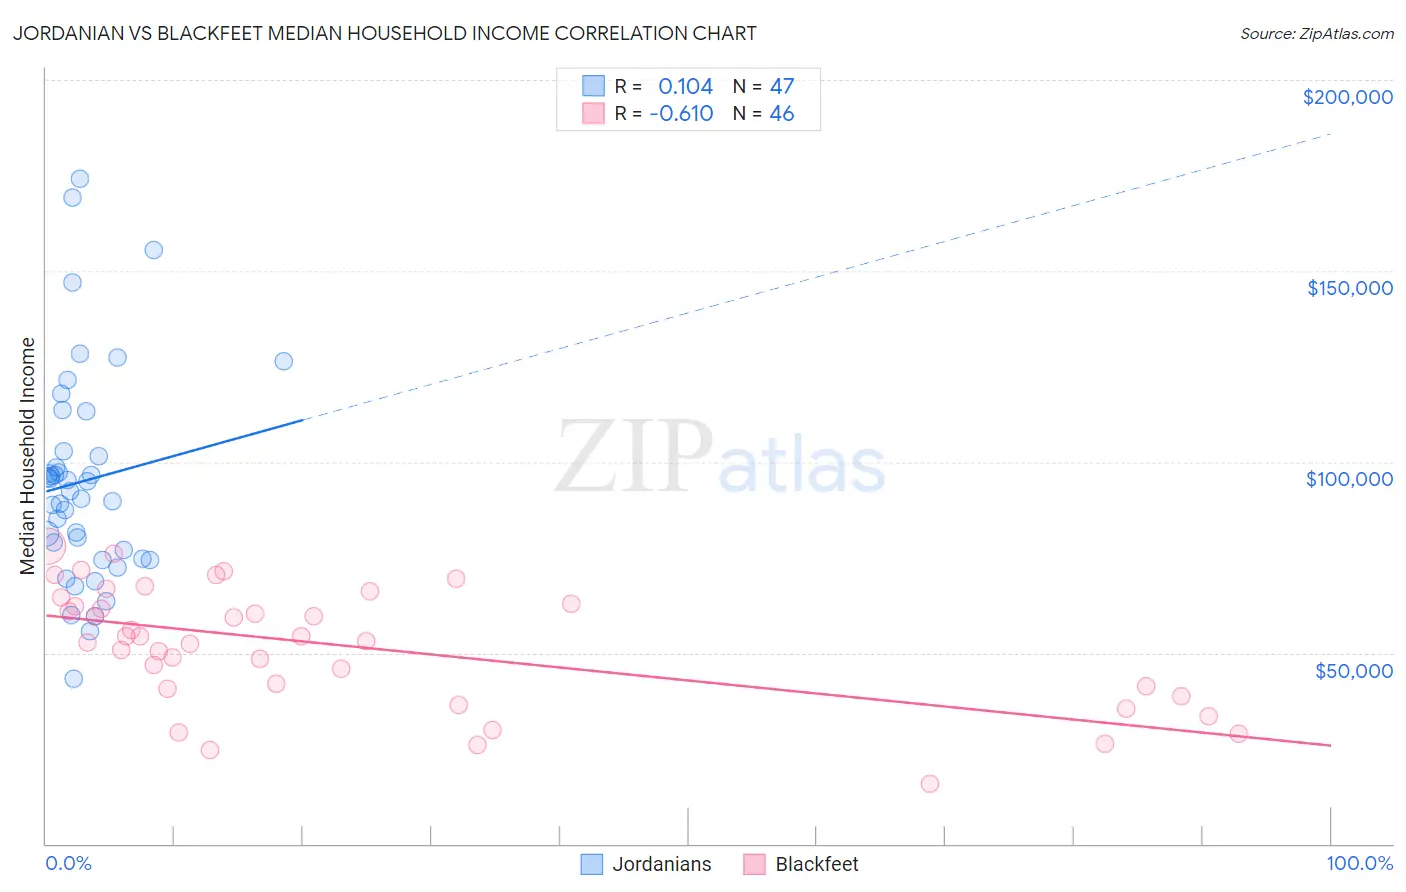
Jordanian vs Blackfeet Median Household Income Correlation Chart
The statistical analysis conducted on geographies consisting of 166,374,087 people shows a poor positive correlation between the proportion of Jordanians and median household income in the United States with a correlation coefficient (R) of 0.104 and weighted average of $91,794. Similarly, the statistical analysis conducted on geographies consisting of 309,432,508 people shows a significant negative correlation between the proportion of Blackfeet and median household income in the United States with a correlation coefficient (R) of -0.610 and weighted average of $73,509, a difference of 24.9%.
Median Household Income Correlation Summary
| Measurement | Jordanian | Blackfeet |
| Minimum | $43,214 | $15,625 |
| Maximum | $174,260 | $77,855 |
| Range | $131,046 | $62,230 |
| Mean | $95,049 | $51,582 |
| Median | $92,429 | $53,641 |
| Interquartile 25% (IQ1) | $74,643 | $40,750 |
| Interquartile 75% (IQ3) | $102,895 | $62,870 |
| Interquartile Range (IQR) | $28,252 | $22,120 |
| Standard Deviation (Sample) | $28,123 | $15,583 |
| Standard Deviation (Population) | $27,822 | $15,413 |
Similar Demographics by Median Household Income
Demographics Similar to Jordanians by Median Household Income
In terms of median household income, the demographic groups most similar to Jordanians are Armenian ($91,807, a difference of 0.010%), Immigrants from North America ($91,860, a difference of 0.070%), Immigrants from Serbia ($91,730, a difference of 0.070%), Immigrants from Lebanon ($91,887, a difference of 0.10%), and Immigrants from Western Europe ($91,936, a difference of 0.15%).
| Demographics | Rating | Rank | Median Household Income |
| Romanians | 98.8 /100 | #89 | Exceptional $91,994 |
| Assyrians/Chaldeans/Syriacs | 98.8 /100 | #90 | Exceptional $91,991 |
| Immigrants | Vietnam | 98.8 /100 | #91 | Exceptional $91,987 |
| Immigrants | Western Europe | 98.8 /100 | #92 | Exceptional $91,936 |
| Immigrants | Lebanon | 98.7 /100 | #93 | Exceptional $91,887 |
| Immigrants | North America | 98.7 /100 | #94 | Exceptional $91,860 |
| Armenians | 98.7 /100 | #95 | Exceptional $91,807 |
| Jordanians | 98.7 /100 | #96 | Exceptional $91,794 |
| Immigrants | Serbia | 98.6 /100 | #97 | Exceptional $91,730 |
| Immigrants | Southern Europe | 98.5 /100 | #98 | Exceptional $91,605 |
| Immigrants | South Eastern Asia | 98.4 /100 | #99 | Exceptional $91,541 |
| Ukrainians | 98.3 /100 | #100 | Exceptional $91,456 |
| Immigrants | Moldova | 98.3 /100 | #101 | Exceptional $91,446 |
| Austrians | 98.2 /100 | #102 | Exceptional $91,339 |
| Immigrants | Ukraine | 98.0 /100 | #103 | Exceptional $91,124 |
Demographics Similar to Blackfeet by Median Household Income
In terms of median household income, the demographic groups most similar to Blackfeet are Immigrants from Cabo Verde ($73,515, a difference of 0.010%), Cuban ($73,392, a difference of 0.16%), Haitian ($73,306, a difference of 0.28%), Comanche ($73,747, a difference of 0.32%), and Hispanic or Latino ($73,823, a difference of 0.43%).
| Demographics | Rating | Rank | Median Household Income |
| Iroquois | 0.1 /100 | #287 | Tragic $74,279 |
| Immigrants | Central America | 0.1 /100 | #288 | Tragic $74,217 |
| Fijians | 0.1 /100 | #289 | Tragic $74,205 |
| Bangladeshis | 0.1 /100 | #290 | Tragic $74,112 |
| Hispanics or Latinos | 0.1 /100 | #291 | Tragic $73,823 |
| Comanche | 0.1 /100 | #292 | Tragic $73,747 |
| Immigrants | Cabo Verde | 0.1 /100 | #293 | Tragic $73,515 |
| Blackfeet | 0.1 /100 | #294 | Tragic $73,509 |
| Cubans | 0.1 /100 | #295 | Tragic $73,392 |
| Haitians | 0.1 /100 | #296 | Tragic $73,306 |
| Immigrants | Mexico | 0.0 /100 | #297 | Tragic $73,160 |
| Paiute | 0.0 /100 | #298 | Tragic $72,959 |
| Indonesians | 0.0 /100 | #299 | Tragic $72,856 |
| Immigrants | Dominica | 0.0 /100 | #300 | Tragic $72,760 |
| Cherokee | 0.0 /100 | #301 | Tragic $72,682 |