Jordanian vs Immigrants from Lithuania Median Household Income
COMPARE
Jordanian
Immigrants from Lithuania
Median Household Income
Median Household Income Comparison
Jordanians
Immigrants from Lithuania
$91,794
MEDIAN HOUSEHOLD INCOME
98.7/ 100
METRIC RATING
96th/ 347
METRIC RANK
$96,836
MEDIAN HOUSEHOLD INCOME
99.9/ 100
METRIC RATING
42nd/ 347
METRIC RANK
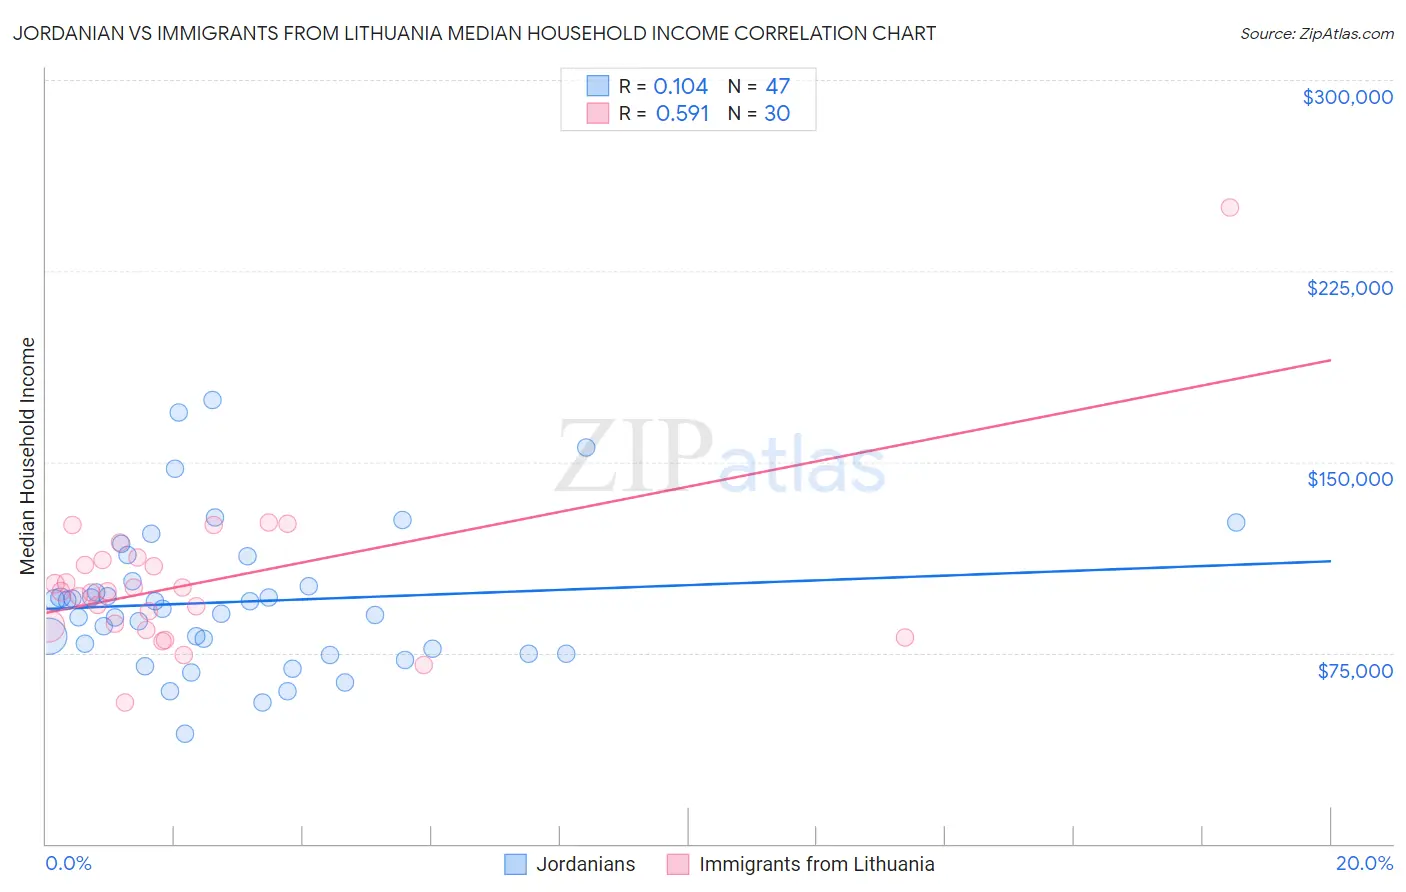
Jordanian vs Immigrants from Lithuania Median Household Income Correlation Chart
The statistical analysis conducted on geographies consisting of 166,374,087 people shows a poor positive correlation between the proportion of Jordanians and median household income in the United States with a correlation coefficient (R) of 0.104 and weighted average of $91,794. Similarly, the statistical analysis conducted on geographies consisting of 117,713,976 people shows a substantial positive correlation between the proportion of Immigrants from Lithuania and median household income in the United States with a correlation coefficient (R) of 0.591 and weighted average of $96,836, a difference of 5.5%.
Median Household Income Correlation Summary
| Measurement | Jordanian | Immigrants from Lithuania |
| Minimum | $43,214 | $55,636 |
| Maximum | $174,260 | $250,001 |
| Range | $131,046 | $194,365 |
| Mean | $95,049 | $102,979 |
| Median | $92,429 | $99,018 |
| Interquartile 25% (IQ1) | $74,643 | $85,668 |
| Interquartile 75% (IQ3) | $102,895 | $111,586 |
| Interquartile Range (IQR) | $28,252 | $25,918 |
| Standard Deviation (Sample) | $28,123 | $32,780 |
| Standard Deviation (Population) | $27,822 | $32,229 |
Similar Demographics by Median Household Income
Demographics Similar to Jordanians by Median Household Income
In terms of median household income, the demographic groups most similar to Jordanians are Armenian ($91,807, a difference of 0.010%), Immigrants from North America ($91,860, a difference of 0.070%), Immigrants from Serbia ($91,730, a difference of 0.070%), Immigrants from Lebanon ($91,887, a difference of 0.10%), and Immigrants from Western Europe ($91,936, a difference of 0.15%).
| Demographics | Rating | Rank | Median Household Income |
| Romanians | 98.8 /100 | #89 | Exceptional $91,994 |
| Assyrians/Chaldeans/Syriacs | 98.8 /100 | #90 | Exceptional $91,991 |
| Immigrants | Vietnam | 98.8 /100 | #91 | Exceptional $91,987 |
| Immigrants | Western Europe | 98.8 /100 | #92 | Exceptional $91,936 |
| Immigrants | Lebanon | 98.7 /100 | #93 | Exceptional $91,887 |
| Immigrants | North America | 98.7 /100 | #94 | Exceptional $91,860 |
| Armenians | 98.7 /100 | #95 | Exceptional $91,807 |
| Jordanians | 98.7 /100 | #96 | Exceptional $91,794 |
| Immigrants | Serbia | 98.6 /100 | #97 | Exceptional $91,730 |
| Immigrants | Southern Europe | 98.5 /100 | #98 | Exceptional $91,605 |
| Immigrants | South Eastern Asia | 98.4 /100 | #99 | Exceptional $91,541 |
| Ukrainians | 98.3 /100 | #100 | Exceptional $91,456 |
| Immigrants | Moldova | 98.3 /100 | #101 | Exceptional $91,446 |
| Austrians | 98.2 /100 | #102 | Exceptional $91,339 |
| Immigrants | Ukraine | 98.0 /100 | #103 | Exceptional $91,124 |
Demographics Similar to Immigrants from Lithuania by Median Household Income
In terms of median household income, the demographic groups most similar to Immigrants from Lithuania are Immigrants from France ($96,743, a difference of 0.10%), Immigrants from Turkey ($96,964, a difference of 0.13%), Immigrants from Greece ($96,675, a difference of 0.17%), Maltese ($97,015, a difference of 0.18%), and Afghan ($97,026, a difference of 0.20%).
| Demographics | Rating | Rank | Median Household Income |
| Immigrants | Switzerland | 100.0 /100 | #35 | Exceptional $97,979 |
| Immigrants | Pakistan | 100.0 /100 | #36 | Exceptional $97,528 |
| Latvians | 100.0 /100 | #37 | Exceptional $97,311 |
| Immigrants | Indonesia | 100.0 /100 | #38 | Exceptional $97,297 |
| Afghans | 100.0 /100 | #39 | Exceptional $97,026 |
| Maltese | 100.0 /100 | #40 | Exceptional $97,015 |
| Immigrants | Turkey | 100.0 /100 | #41 | Exceptional $96,964 |
| Immigrants | Lithuania | 99.9 /100 | #42 | Exceptional $96,836 |
| Immigrants | France | 99.9 /100 | #43 | Exceptional $96,743 |
| Immigrants | Greece | 99.9 /100 | #44 | Exceptional $96,675 |
| Israelis | 99.9 /100 | #45 | Exceptional $96,552 |
| Australians | 99.9 /100 | #46 | Exceptional $96,490 |
| Immigrants | Russia | 99.9 /100 | #47 | Exceptional $96,378 |
| Cambodians | 99.9 /100 | #48 | Exceptional $96,324 |
| Immigrants | Malaysia | 99.9 /100 | #49 | Exceptional $96,292 |