Jordanian vs Armenian Median Household Income
COMPARE
Jordanian
Armenian
Median Household Income
Median Household Income Comparison
Jordanians
Armenians
$91,794
MEDIAN HOUSEHOLD INCOME
98.7/ 100
METRIC RATING
96th/ 347
METRIC RANK
$91,807
MEDIAN HOUSEHOLD INCOME
98.7/ 100
METRIC RATING
95th/ 347
METRIC RANK
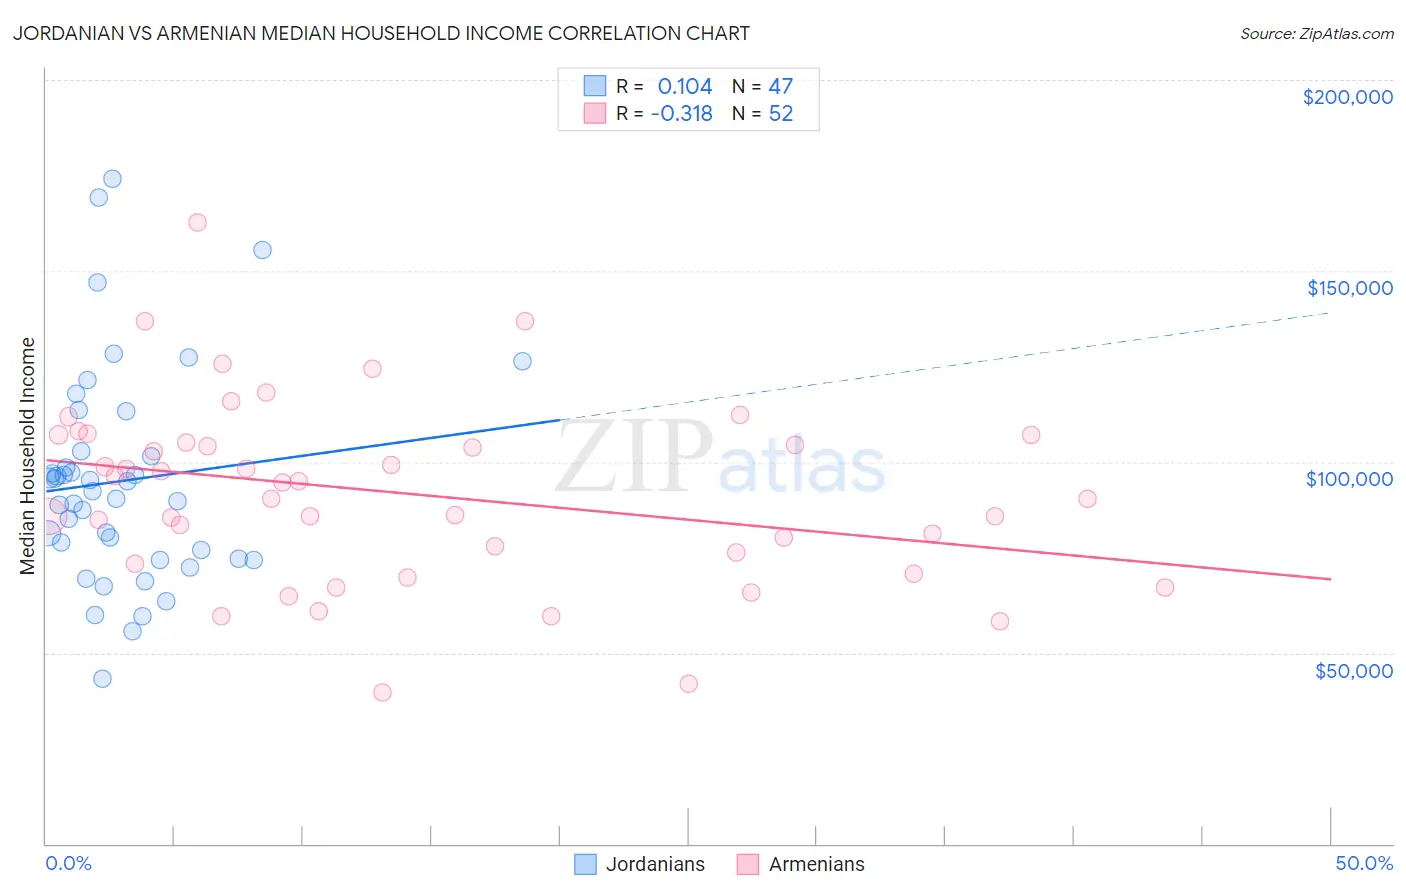
Jordanian vs Armenian Median Household Income Correlation Chart
The statistical analysis conducted on geographies consisting of 166,374,087 people shows a poor positive correlation between the proportion of Jordanians and median household income in the United States with a correlation coefficient (R) of 0.104 and weighted average of $91,794. Similarly, the statistical analysis conducted on geographies consisting of 310,713,421 people shows a mild negative correlation between the proportion of Armenians and median household income in the United States with a correlation coefficient (R) of -0.318 and weighted average of $91,807, a difference of 0.010%.
Median Household Income Correlation Summary
| Measurement | Jordanian | Armenian |
| Minimum | $43,214 | $39,713 |
| Maximum | $174,260 | $162,732 |
| Range | $131,046 | $123,019 |
| Mean | $95,049 | $91,613 |
| Median | $92,429 | $92,502 |
| Interquartile 25% (IQ1) | $74,643 | $74,815 |
| Interquartile 75% (IQ3) | $102,895 | $106,031 |
| Interquartile Range (IQR) | $28,252 | $31,215 |
| Standard Deviation (Sample) | $28,123 | $24,104 |
| Standard Deviation (Population) | $27,822 | $23,871 |
Demographics Similar to Jordanians and Armenians by Median Household Income
In terms of median household income, the demographic groups most similar to Jordanians are Immigrants from North America ($91,860, a difference of 0.070%), Immigrants from Serbia ($91,730, a difference of 0.070%), Immigrants from Lebanon ($91,887, a difference of 0.10%), Immigrants from Western Europe ($91,936, a difference of 0.15%), and Assyrian/Chaldean/Syriac ($91,991, a difference of 0.21%). Similarly, the demographic groups most similar to Armenians are Immigrants from North America ($91,860, a difference of 0.060%), Immigrants from Serbia ($91,730, a difference of 0.080%), Immigrants from Lebanon ($91,887, a difference of 0.090%), Immigrants from Western Europe ($91,936, a difference of 0.14%), and Romanian ($91,994, a difference of 0.20%).
| Demographics | Rating | Rank | Median Household Income |
| Immigrants | Croatia | 99.0 /100 | #85 | Exceptional $92,225 |
| Immigrants | England | 98.9 /100 | #86 | Exceptional $92,098 |
| Immigrants | Hungary | 98.9 /100 | #87 | Exceptional $92,094 |
| Immigrants | Canada | 98.8 /100 | #88 | Exceptional $92,029 |
| Romanians | 98.8 /100 | #89 | Exceptional $91,994 |
| Assyrians/Chaldeans/Syriacs | 98.8 /100 | #90 | Exceptional $91,991 |
| Immigrants | Vietnam | 98.8 /100 | #91 | Exceptional $91,987 |
| Immigrants | Western Europe | 98.8 /100 | #92 | Exceptional $91,936 |
| Immigrants | Lebanon | 98.7 /100 | #93 | Exceptional $91,887 |
| Immigrants | North America | 98.7 /100 | #94 | Exceptional $91,860 |
| Armenians | 98.7 /100 | #95 | Exceptional $91,807 |
| Jordanians | 98.7 /100 | #96 | Exceptional $91,794 |
| Immigrants | Serbia | 98.6 /100 | #97 | Exceptional $91,730 |
| Immigrants | Southern Europe | 98.5 /100 | #98 | Exceptional $91,605 |
| Immigrants | South Eastern Asia | 98.4 /100 | #99 | Exceptional $91,541 |
| Ukrainians | 98.3 /100 | #100 | Exceptional $91,456 |
| Immigrants | Moldova | 98.3 /100 | #101 | Exceptional $91,446 |
| Austrians | 98.2 /100 | #102 | Exceptional $91,339 |
| Immigrants | Ukraine | 98.0 /100 | #103 | Exceptional $91,124 |
| Immigrants | Kazakhstan | 97.8 /100 | #104 | Exceptional $91,015 |
| Immigrants | Brazil | 97.7 /100 | #105 | Exceptional $90,907 |