Jordanian vs Slavic Wage/Income Gap
COMPARE
Jordanian
Slavic
Wage/Income Gap
Wage/Income Gap Comparison
Jordanians
Slavs
26.8%
WAGE/INCOME GAP
8.0/ 100
METRIC RATING
223rd/ 347
METRIC RANK
27.4%
WAGE/INCOME GAP
1.8/ 100
METRIC RATING
258th/ 347
METRIC RANK
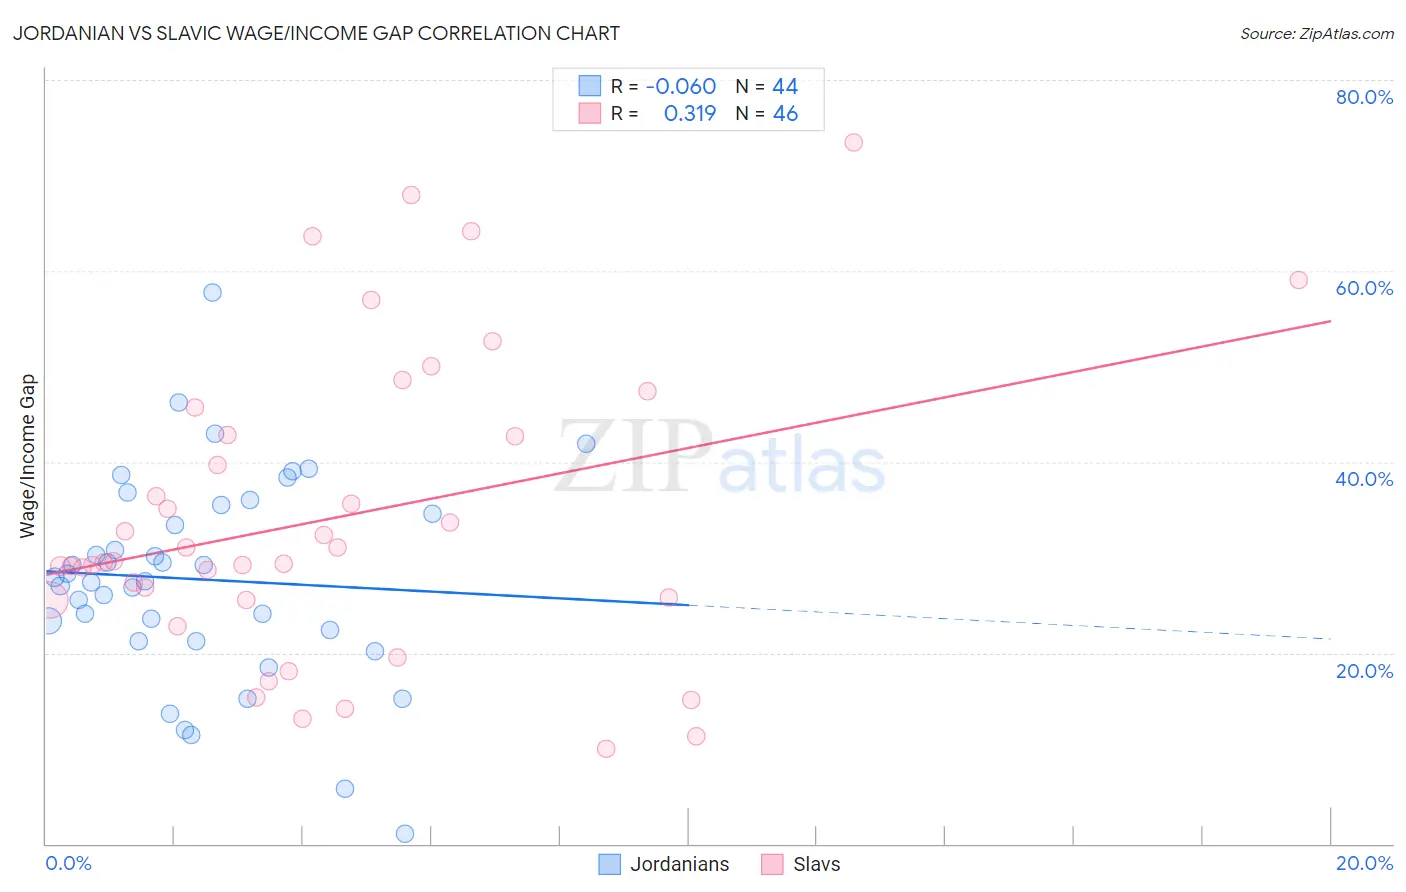
Jordanian vs Slavic Wage/Income Gap Correlation Chart
The statistical analysis conducted on geographies consisting of 166,410,383 people shows a slight negative correlation between the proportion of Jordanians and wage/income gap percentage in the United States with a correlation coefficient (R) of -0.060 and weighted average of 26.8%. Similarly, the statistical analysis conducted on geographies consisting of 270,754,650 people shows a mild positive correlation between the proportion of Slavs and wage/income gap percentage in the United States with a correlation coefficient (R) of 0.319 and weighted average of 27.4%, a difference of 2.4%.
Wage/Income Gap Correlation Summary
| Measurement | Jordanian | Slavic |
| Minimum | 1.1% | 10.0% |
| Maximum | 57.8% | 73.5% |
| Range | 56.7% | 63.5% |
| Mean | 27.7% | 34.2% |
| Median | 27.7% | 29.5% |
| Interquartile 25% (IQ1) | 21.8% | 25.6% |
| Interquartile 75% (IQ3) | 35.0% | 42.9% |
| Interquartile Range (IQR) | 13.2% | 17.3% |
| Standard Deviation (Sample) | 10.8% | 15.7% |
| Standard Deviation (Population) | 10.7% | 15.5% |
Similar Demographics by Wage/Income Gap
Demographics Similar to Jordanians by Wage/Income Gap
In terms of wage/income gap, the demographic groups most similar to Jordanians are Bolivian (26.8%, a difference of 0.070%), Immigrants from Spain (26.8%, a difference of 0.11%), Immigrants from Argentina (26.8%, a difference of 0.17%), Immigrants from Latvia (26.7%, a difference of 0.18%), and Immigrants from Poland (26.7%, a difference of 0.19%).
| Demographics | Rating | Rank | Wage/Income Gap |
| Immigrants | Portugal | 9.5 /100 | #216 | Tragic 26.7% |
| Brazilians | 9.2 /100 | #217 | Tragic 26.7% |
| Immigrants | Saudi Arabia | 9.1 /100 | #218 | Tragic 26.7% |
| Immigrants | Poland | 8.9 /100 | #219 | Tragic 26.7% |
| Immigrants | Latvia | 8.9 /100 | #220 | Tragic 26.7% |
| Immigrants | Spain | 8.5 /100 | #221 | Tragic 26.8% |
| Bolivians | 8.3 /100 | #222 | Tragic 26.8% |
| Jordanians | 8.0 /100 | #223 | Tragic 26.8% |
| Immigrants | Argentina | 7.2 /100 | #224 | Tragic 26.8% |
| Immigrants | Ireland | 6.5 /100 | #225 | Tragic 26.9% |
| Asians | 5.9 /100 | #226 | Tragic 26.9% |
| Spaniards | 5.6 /100 | #227 | Tragic 27.0% |
| Immigrants | Turkey | 5.6 /100 | #228 | Tragic 27.0% |
| Immigrants | Asia | 5.5 /100 | #229 | Tragic 27.0% |
| Ottawa | 5.3 /100 | #230 | Tragic 27.0% |
Demographics Similar to Slavs by Wage/Income Gap
In terms of wage/income gap, the demographic groups most similar to Slavs are Luxembourger (27.4%, a difference of 0.040%), Icelander (27.5%, a difference of 0.080%), Cherokee (27.4%, a difference of 0.090%), Tongan (27.5%, a difference of 0.090%), and Immigrants from France (27.4%, a difference of 0.19%).
| Demographics | Rating | Rank | Wage/Income Gap |
| Immigrants | Norway | 2.5 /100 | #251 | Tragic 27.3% |
| Ukrainians | 2.4 /100 | #252 | Tragic 27.3% |
| Portuguese | 2.2 /100 | #253 | Tragic 27.4% |
| Israelis | 2.1 /100 | #254 | Tragic 27.4% |
| Immigrants | France | 2.1 /100 | #255 | Tragic 27.4% |
| Cherokee | 1.9 /100 | #256 | Tragic 27.4% |
| Luxembourgers | 1.9 /100 | #257 | Tragic 27.4% |
| Slavs | 1.8 /100 | #258 | Tragic 27.4% |
| Icelanders | 1.8 /100 | #259 | Tragic 27.5% |
| Tongans | 1.7 /100 | #260 | Tragic 27.5% |
| Immigrants | Germany | 1.5 /100 | #261 | Tragic 27.5% |
| Immigrants | Lebanon | 1.5 /100 | #262 | Tragic 27.5% |
| Syrians | 1.4 /100 | #263 | Tragic 27.6% |
| Immigrants | Switzerland | 1.0 /100 | #264 | Tragic 27.7% |
| Serbians | 1.0 /100 | #265 | Tragic 27.7% |