Dominican vs West Indian Median Family Income
COMPARE
Dominican
West Indian
Median Family Income
Median Family Income Comparison
Dominicans
West Indians
$82,888
MEDIAN FAMILY INCOME
0.0/ 100
METRIC RATING
322nd/ 347
METRIC RANK
$92,765
MEDIAN FAMILY INCOME
0.6/ 100
METRIC RATING
250th/ 347
METRIC RANK
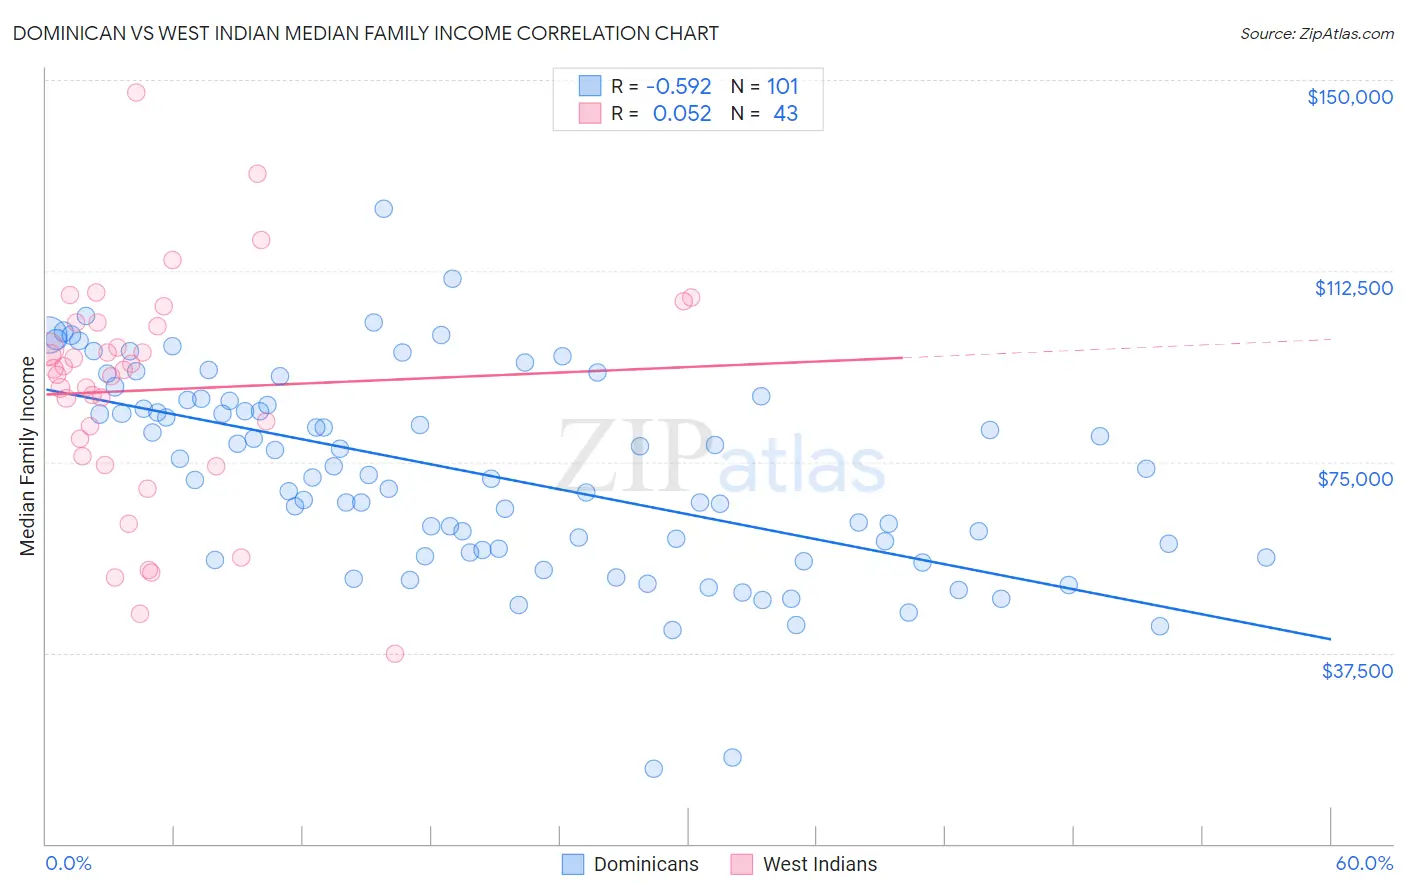
Dominican vs West Indian Median Family Income Correlation Chart
The statistical analysis conducted on geographies consisting of 354,580,571 people shows a substantial negative correlation between the proportion of Dominicans and median family income in the United States with a correlation coefficient (R) of -0.592 and weighted average of $82,888. Similarly, the statistical analysis conducted on geographies consisting of 253,786,025 people shows a slight positive correlation between the proportion of West Indians and median family income in the United States with a correlation coefficient (R) of 0.052 and weighted average of $92,765, a difference of 11.9%.
Median Family Income Correlation Summary
| Measurement | Dominican | West Indian |
| Minimum | $14,766 | $37,244 |
| Maximum | $124,734 | $147,600 |
| Range | $109,968 | $110,356 |
| Mean | $72,735 | $89,153 |
| Median | $72,364 | $92,948 |
| Interquartile 25% (IQ1) | $57,406 | $76,053 |
| Interquartile 75% (IQ3) | $87,079 | $102,268 |
| Interquartile Range (IQR) | $29,673 | $26,215 |
| Standard Deviation (Sample) | $19,775 | $22,238 |
| Standard Deviation (Population) | $19,677 | $21,978 |
Similar Demographics by Median Family Income
Demographics Similar to Dominicans by Median Family Income
In terms of median family income, the demographic groups most similar to Dominicans are Bahamian ($82,631, a difference of 0.31%), Creek ($82,560, a difference of 0.40%), Immigrants from Caribbean ($83,319, a difference of 0.52%), Seminole ($83,354, a difference of 0.56%), and Sioux ($82,386, a difference of 0.61%).
| Demographics | Rating | Rank | Median Family Income |
| Apache | 0.0 /100 | #315 | Tragic $84,451 |
| Immigrants | Haiti | 0.0 /100 | #316 | Tragic $84,018 |
| Yakama | 0.0 /100 | #317 | Tragic $83,932 |
| Immigrants | Mexico | 0.0 /100 | #318 | Tragic $83,639 |
| Immigrants | Honduras | 0.0 /100 | #319 | Tragic $83,618 |
| Seminole | 0.0 /100 | #320 | Tragic $83,354 |
| Immigrants | Caribbean | 0.0 /100 | #321 | Tragic $83,319 |
| Dominicans | 0.0 /100 | #322 | Tragic $82,888 |
| Bahamians | 0.0 /100 | #323 | Tragic $82,631 |
| Creek | 0.0 /100 | #324 | Tragic $82,560 |
| Sioux | 0.0 /100 | #325 | Tragic $82,386 |
| Immigrants | Congo | 0.0 /100 | #326 | Tragic $82,216 |
| Arapaho | 0.0 /100 | #327 | Tragic $82,064 |
| Blacks/African Americans | 0.0 /100 | #328 | Tragic $81,912 |
| Dutch West Indians | 0.0 /100 | #329 | Tragic $81,852 |
Demographics Similar to West Indians by Median Family Income
In terms of median family income, the demographic groups most similar to West Indians are Immigrants from Ecuador ($92,837, a difference of 0.080%), French American Indian ($92,872, a difference of 0.11%), Immigrants from Senegal ($92,912, a difference of 0.16%), Immigrants from Somalia ($92,609, a difference of 0.17%), and Immigrants from El Salvador ($92,545, a difference of 0.24%).
| Demographics | Rating | Rank | Median Family Income |
| German Russians | 1.1 /100 | #243 | Tragic $93,858 |
| Sub-Saharan Africans | 1.0 /100 | #244 | Tragic $93,748 |
| Immigrants | Middle Africa | 1.0 /100 | #245 | Tragic $93,593 |
| Guyanese | 0.9 /100 | #246 | Tragic $93,373 |
| Immigrants | Senegal | 0.7 /100 | #247 | Tragic $92,912 |
| French American Indians | 0.7 /100 | #248 | Tragic $92,872 |
| Immigrants | Ecuador | 0.7 /100 | #249 | Tragic $92,837 |
| West Indians | 0.6 /100 | #250 | Tragic $92,765 |
| Immigrants | Somalia | 0.6 /100 | #251 | Tragic $92,609 |
| Immigrants | El Salvador | 0.6 /100 | #252 | Tragic $92,545 |
| Immigrants | Guyana | 0.6 /100 | #253 | Tragic $92,513 |
| Immigrants | Barbados | 0.5 /100 | #254 | Tragic $92,419 |
| Immigrants | Laos | 0.5 /100 | #255 | Tragic $92,239 |
| Nicaraguans | 0.5 /100 | #256 | Tragic $92,231 |
| Americans | 0.4 /100 | #257 | Tragic $92,096 |