Jamaican vs West Indian Single Father Households
COMPARE
Jamaican
West Indian
Single Father Households
Single Father Households Comparison
Jamaicans
West Indians
2.3%
SINGLE FATHER HOUSEHOLDS
43.5/ 100
METRIC RATING
181st/ 347
METRIC RANK
2.2%
SINGLE FATHER HOUSEHOLDS
94.1/ 100
METRIC RATING
138th/ 347
METRIC RANK
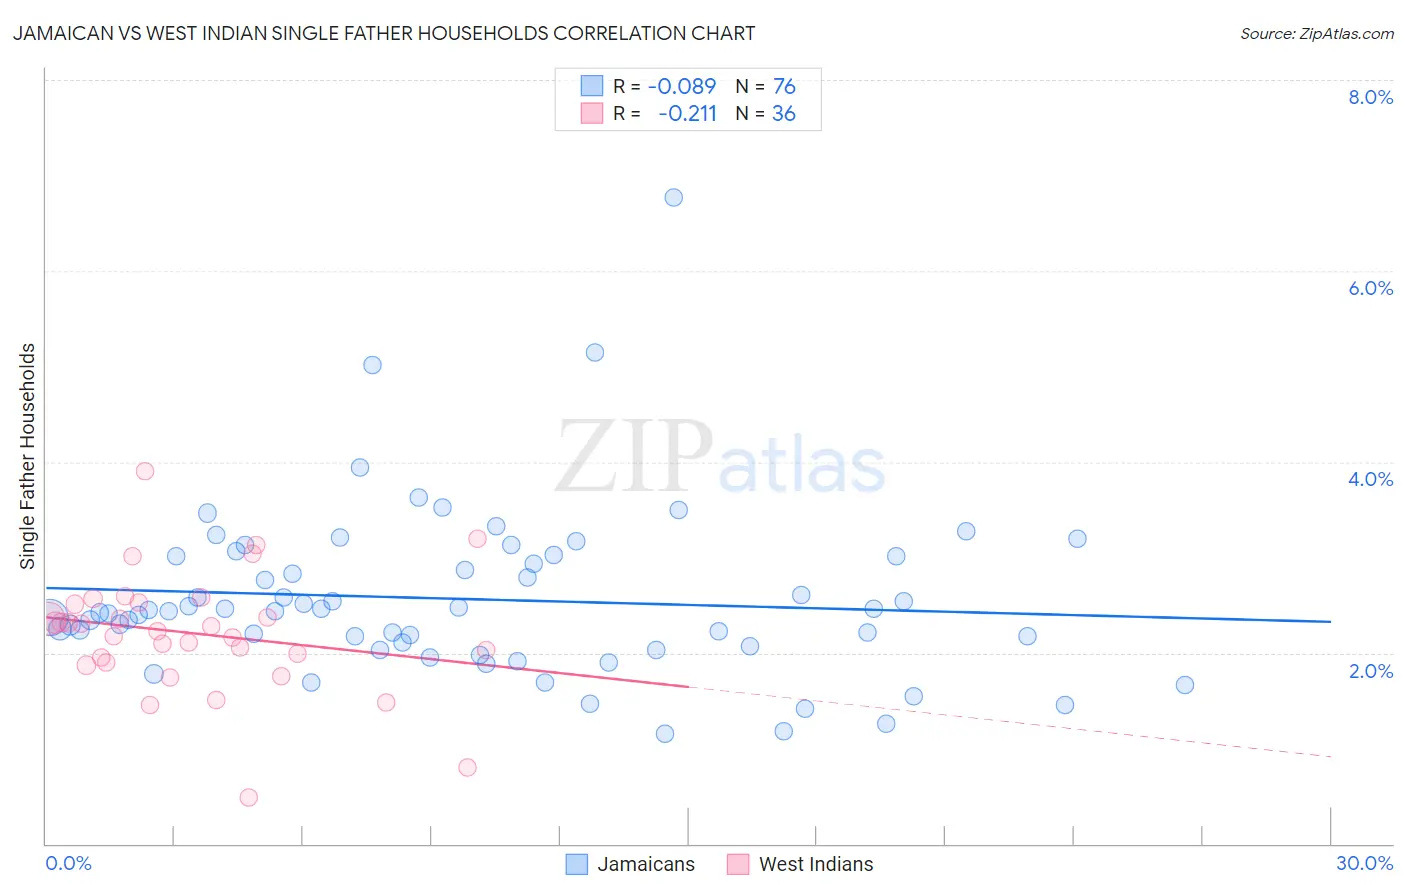
Jamaican vs West Indian Single Father Households Correlation Chart
The statistical analysis conducted on geographies consisting of 365,117,858 people shows a slight negative correlation between the proportion of Jamaicans and percentage of single father households in the United States with a correlation coefficient (R) of -0.089 and weighted average of 2.3%. Similarly, the statistical analysis conducted on geographies consisting of 252,761,215 people shows a weak negative correlation between the proportion of West Indians and percentage of single father households in the United States with a correlation coefficient (R) of -0.211 and weighted average of 2.2%, a difference of 5.9%.
Single Father Households Correlation Summary
| Measurement | Jamaican | West Indian |
| Minimum | 1.2% | 0.49% |
| Maximum | 6.8% | 3.9% |
| Range | 5.6% | 3.4% |
| Mean | 2.6% | 2.2% |
| Median | 2.4% | 2.3% |
| Interquartile 25% (IQ1) | 2.1% | 1.9% |
| Interquartile 75% (IQ3) | 3.0% | 2.5% |
| Interquartile Range (IQR) | 0.92% | 0.60% |
| Standard Deviation (Sample) | 0.88% | 0.64% |
| Standard Deviation (Population) | 0.88% | 0.63% |
Similar Demographics by Single Father Households
Demographics Similar to Jamaicans by Single Father Households
In terms of single father households, the demographic groups most similar to Jamaicans are Belgian (2.3%, a difference of 0.020%), Yugoslavian (2.3%, a difference of 0.030%), Costa Rican (2.3%, a difference of 0.040%), Welsh (2.3%, a difference of 0.040%), and Immigrants from Panama (2.4%, a difference of 0.12%).
| Demographics | Rating | Rank | Single Father Households |
| Afghans | 50.0 /100 | #174 | Average 2.3% |
| Immigrants | Jamaica | 49.1 /100 | #175 | Average 2.3% |
| Danes | 48.2 /100 | #176 | Average 2.3% |
| Colombians | 48.0 /100 | #177 | Average 2.3% |
| Costa Ricans | 44.1 /100 | #178 | Average 2.3% |
| Welsh | 44.0 /100 | #179 | Average 2.3% |
| Yugoslavians | 43.9 /100 | #180 | Average 2.3% |
| Jamaicans | 43.5 /100 | #181 | Average 2.3% |
| Belgians | 43.3 /100 | #182 | Average 2.3% |
| Immigrants | Panama | 41.8 /100 | #183 | Average 2.4% |
| Sri Lankans | 41.8 /100 | #184 | Average 2.4% |
| Nigerians | 41.0 /100 | #185 | Average 2.4% |
| Immigrants | Bosnia and Herzegovina | 40.4 /100 | #186 | Average 2.4% |
| Immigrants | Colombia | 34.0 /100 | #187 | Fair 2.4% |
| Hmong | 33.0 /100 | #188 | Fair 2.4% |
Demographics Similar to West Indians by Single Father Households
In terms of single father households, the demographic groups most similar to West Indians are Austrian (2.2%, a difference of 0.030%), Chilean (2.2%, a difference of 0.14%), Syrian (2.2%, a difference of 0.26%), Zimbabwean (2.2%, a difference of 0.37%), and Brazilian (2.2%, a difference of 0.42%).
| Demographics | Rating | Rank | Single Father Households |
| Immigrants | Jordan | 96.6 /100 | #131 | Exceptional 2.2% |
| Poles | 96.5 /100 | #132 | Exceptional 2.2% |
| Taiwanese | 96.3 /100 | #133 | Exceptional 2.2% |
| Zimbabweans | 95.1 /100 | #134 | Exceptional 2.2% |
| Syrians | 94.8 /100 | #135 | Exceptional 2.2% |
| Chileans | 94.5 /100 | #136 | Exceptional 2.2% |
| Austrians | 94.2 /100 | #137 | Exceptional 2.2% |
| West Indians | 94.1 /100 | #138 | Exceptional 2.2% |
| Brazilians | 92.8 /100 | #139 | Exceptional 2.2% |
| British | 92.8 /100 | #140 | Exceptional 2.2% |
| Laotians | 92.5 /100 | #141 | Exceptional 2.2% |
| Luxembourgers | 92.3 /100 | #142 | Exceptional 2.2% |
| Immigrants | Nepal | 92.1 /100 | #143 | Exceptional 2.2% |
| Slovaks | 90.7 /100 | #144 | Exceptional 2.2% |
| Immigrants | Zimbabwe | 90.2 /100 | #145 | Exceptional 2.2% |