Immigrants from Chile vs West Indian Median Family Income
COMPARE
Immigrants from Chile
West Indian
Median Family Income
Median Family Income Comparison
Immigrants from Chile
West Indians
$105,655
MEDIAN FAMILY INCOME
82.1/ 100
METRIC RATING
147th/ 347
METRIC RANK
$92,765
MEDIAN FAMILY INCOME
0.6/ 100
METRIC RATING
250th/ 347
METRIC RANK
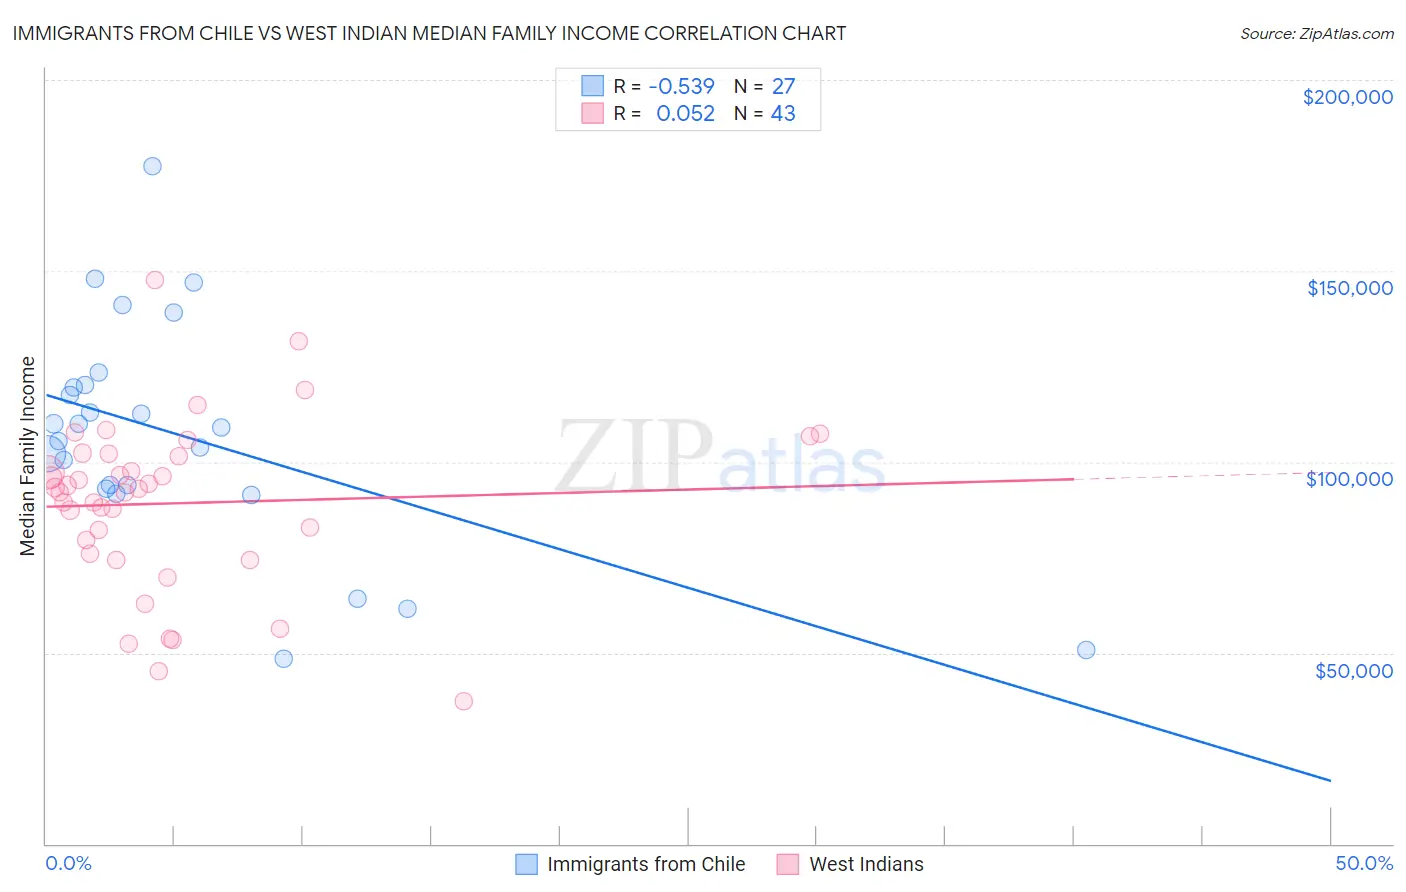
Immigrants from Chile vs West Indian Median Family Income Correlation Chart
The statistical analysis conducted on geographies consisting of 218,577,241 people shows a substantial negative correlation between the proportion of Immigrants from Chile and median family income in the United States with a correlation coefficient (R) of -0.539 and weighted average of $105,655. Similarly, the statistical analysis conducted on geographies consisting of 253,786,025 people shows a slight positive correlation between the proportion of West Indians and median family income in the United States with a correlation coefficient (R) of 0.052 and weighted average of $92,765, a difference of 13.9%.
Median Family Income Correlation Summary
| Measurement | Immigrants from Chile | West Indian |
| Minimum | $48,403 | $37,244 |
| Maximum | $177,440 | $147,600 |
| Range | $129,037 | $110,356 |
| Mean | $106,979 | $89,153 |
| Median | $109,000 | $92,948 |
| Interquartile 25% (IQ1) | $92,919 | $76,053 |
| Interquartile 75% (IQ3) | $120,092 | $102,268 |
| Interquartile Range (IQR) | $27,173 | $26,215 |
| Standard Deviation (Sample) | $29,634 | $22,238 |
| Standard Deviation (Population) | $29,080 | $21,978 |
Similar Demographics by Median Family Income
Demographics Similar to Immigrants from Chile by Median Family Income
In terms of median family income, the demographic groups most similar to Immigrants from Chile are Hungarian ($105,609, a difference of 0.040%), Immigrants from Germany ($105,507, a difference of 0.14%), Czech ($105,839, a difference of 0.17%), Irish ($105,453, a difference of 0.19%), and Peruvian ($105,444, a difference of 0.20%).
| Demographics | Rating | Rank | Median Family Income |
| Norwegians | 85.5 /100 | #140 | Excellent $106,144 |
| Immigrants | Syria | 85.3 /100 | #141 | Excellent $106,118 |
| Slovenes | 84.7 /100 | #142 | Excellent $106,020 |
| Tongans | 84.3 /100 | #143 | Excellent $105,967 |
| Immigrants | Morocco | 84.3 /100 | #144 | Excellent $105,964 |
| Danes | 83.8 /100 | #145 | Excellent $105,900 |
| Czechs | 83.4 /100 | #146 | Excellent $105,839 |
| Immigrants | Chile | 82.1 /100 | #147 | Excellent $105,655 |
| Hungarians | 81.7 /100 | #148 | Excellent $105,609 |
| Immigrants | Germany | 80.9 /100 | #149 | Excellent $105,507 |
| Irish | 80.5 /100 | #150 | Excellent $105,453 |
| Peruvians | 80.4 /100 | #151 | Excellent $105,444 |
| Immigrants | Albania | 79.1 /100 | #152 | Good $105,285 |
| Slavs | 77.9 /100 | #153 | Good $105,144 |
| Immigrants | Nepal | 76.3 /100 | #154 | Good $104,966 |
Demographics Similar to West Indians by Median Family Income
In terms of median family income, the demographic groups most similar to West Indians are Immigrants from Ecuador ($92,837, a difference of 0.080%), French American Indian ($92,872, a difference of 0.11%), Immigrants from Senegal ($92,912, a difference of 0.16%), Immigrants from Somalia ($92,609, a difference of 0.17%), and Immigrants from El Salvador ($92,545, a difference of 0.24%).
| Demographics | Rating | Rank | Median Family Income |
| German Russians | 1.1 /100 | #243 | Tragic $93,858 |
| Sub-Saharan Africans | 1.0 /100 | #244 | Tragic $93,748 |
| Immigrants | Middle Africa | 1.0 /100 | #245 | Tragic $93,593 |
| Guyanese | 0.9 /100 | #246 | Tragic $93,373 |
| Immigrants | Senegal | 0.7 /100 | #247 | Tragic $92,912 |
| French American Indians | 0.7 /100 | #248 | Tragic $92,872 |
| Immigrants | Ecuador | 0.7 /100 | #249 | Tragic $92,837 |
| West Indians | 0.6 /100 | #250 | Tragic $92,765 |
| Immigrants | Somalia | 0.6 /100 | #251 | Tragic $92,609 |
| Immigrants | El Salvador | 0.6 /100 | #252 | Tragic $92,545 |
| Immigrants | Guyana | 0.6 /100 | #253 | Tragic $92,513 |
| Immigrants | Barbados | 0.5 /100 | #254 | Tragic $92,419 |
| Immigrants | Laos | 0.5 /100 | #255 | Tragic $92,239 |
| Nicaraguans | 0.5 /100 | #256 | Tragic $92,231 |
| Americans | 0.4 /100 | #257 | Tragic $92,096 |