Cambodian vs French American Indian Median Family Income
COMPARE
Cambodian
French American Indian
Median Family Income
Median Family Income Comparison
Cambodians
French American Indians
$117,780
MEDIAN FAMILY INCOME
100.0/ 100
METRIC RATING
44th/ 347
METRIC RANK
$92,872
MEDIAN FAMILY INCOME
0.7/ 100
METRIC RATING
248th/ 347
METRIC RANK
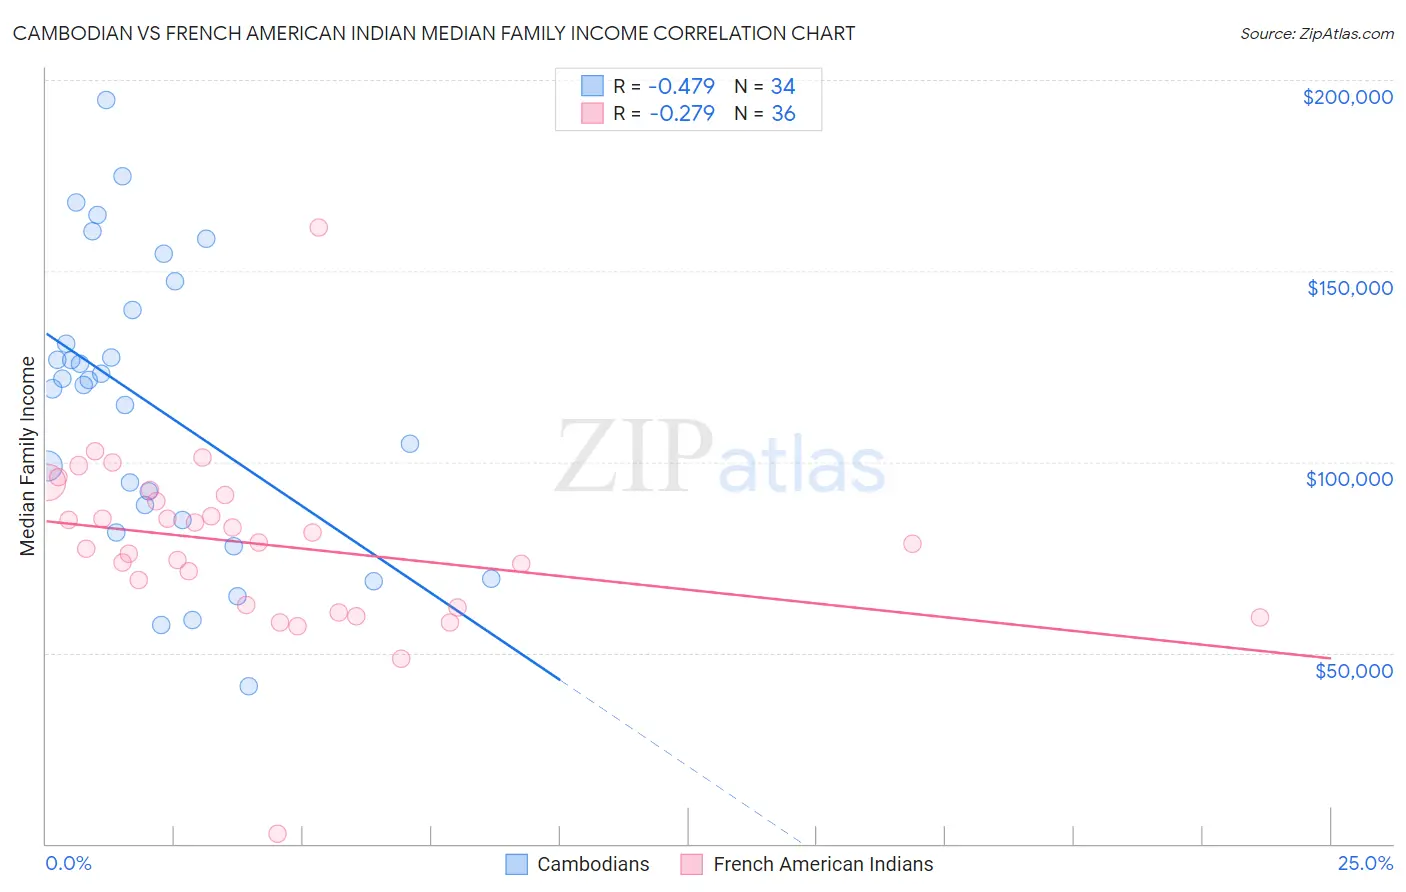
Cambodian vs French American Indian Median Family Income Correlation Chart
The statistical analysis conducted on geographies consisting of 102,461,045 people shows a moderate negative correlation between the proportion of Cambodians and median family income in the United States with a correlation coefficient (R) of -0.479 and weighted average of $117,780. Similarly, the statistical analysis conducted on geographies consisting of 131,949,882 people shows a weak negative correlation between the proportion of French American Indians and median family income in the United States with a correlation coefficient (R) of -0.279 and weighted average of $92,872, a difference of 26.8%.
Median Family Income Correlation Summary
| Measurement | Cambodian | French American Indian |
| Minimum | $41,250 | $2,499 |
| Maximum | $194,752 | $161,250 |
| Range | $153,502 | $158,751 |
| Mean | $114,811 | $78,273 |
| Median | $120,749 | $78,700 |
| Interquartile 25% (IQ1) | $84,853 | $62,262 |
| Interquartile 75% (IQ3) | $139,722 | $90,496 |
| Interquartile Range (IQR) | $54,869 | $28,234 |
| Standard Deviation (Sample) | $37,903 | $23,852 |
| Standard Deviation (Population) | $37,342 | $23,519 |
Similar Demographics by Median Family Income
Demographics Similar to Cambodians by Median Family Income
In terms of median family income, the demographic groups most similar to Cambodians are Bulgarian ($117,818, a difference of 0.030%), Immigrants from Bolivia ($117,912, a difference of 0.11%), Estonian ($118,013, a difference of 0.20%), Immigrants from Lithuania ($118,053, a difference of 0.23%), and Immigrants from Greece ($117,344, a difference of 0.37%).
| Demographics | Rating | Rank | Median Family Income |
| Australians | 100.0 /100 | #37 | Exceptional $118,440 |
| Immigrants | Turkey | 100.0 /100 | #38 | Exceptional $118,325 |
| Immigrants | Asia | 100.0 /100 | #39 | Exceptional $118,291 |
| Immigrants | Lithuania | 100.0 /100 | #40 | Exceptional $118,053 |
| Estonians | 100.0 /100 | #41 | Exceptional $118,013 |
| Immigrants | Bolivia | 100.0 /100 | #42 | Exceptional $117,912 |
| Bulgarians | 100.0 /100 | #43 | Exceptional $117,818 |
| Cambodians | 100.0 /100 | #44 | Exceptional $117,780 |
| Immigrants | Greece | 99.9 /100 | #45 | Exceptional $117,344 |
| Immigrants | Russia | 99.9 /100 | #46 | Exceptional $116,942 |
| Immigrants | Austria | 99.9 /100 | #47 | Exceptional $116,830 |
| Immigrants | South Africa | 99.9 /100 | #48 | Exceptional $116,286 |
| Chinese | 99.9 /100 | #49 | Exceptional $116,188 |
| Immigrants | Czechoslovakia | 99.9 /100 | #50 | Exceptional $116,165 |
| Immigrants | Malaysia | 99.9 /100 | #51 | Exceptional $115,880 |
Demographics Similar to French American Indians by Median Family Income
In terms of median family income, the demographic groups most similar to French American Indians are Immigrants from Senegal ($92,912, a difference of 0.040%), Immigrants from Ecuador ($92,837, a difference of 0.040%), West Indian ($92,765, a difference of 0.11%), Immigrants from Somalia ($92,609, a difference of 0.28%), and Immigrants from El Salvador ($92,545, a difference of 0.35%).
| Demographics | Rating | Rank | Median Family Income |
| Immigrants | Trinidad and Tobago | 1.2 /100 | #241 | Tragic $93,988 |
| Barbadians | 1.1 /100 | #242 | Tragic $93,919 |
| German Russians | 1.1 /100 | #243 | Tragic $93,858 |
| Sub-Saharan Africans | 1.0 /100 | #244 | Tragic $93,748 |
| Immigrants | Middle Africa | 1.0 /100 | #245 | Tragic $93,593 |
| Guyanese | 0.9 /100 | #246 | Tragic $93,373 |
| Immigrants | Senegal | 0.7 /100 | #247 | Tragic $92,912 |
| French American Indians | 0.7 /100 | #248 | Tragic $92,872 |
| Immigrants | Ecuador | 0.7 /100 | #249 | Tragic $92,837 |
| West Indians | 0.6 /100 | #250 | Tragic $92,765 |
| Immigrants | Somalia | 0.6 /100 | #251 | Tragic $92,609 |
| Immigrants | El Salvador | 0.6 /100 | #252 | Tragic $92,545 |
| Immigrants | Guyana | 0.6 /100 | #253 | Tragic $92,513 |
| Immigrants | Barbados | 0.5 /100 | #254 | Tragic $92,419 |
| Immigrants | Laos | 0.5 /100 | #255 | Tragic $92,239 |