Immigrants from Germany vs French American Indian Median Family Income
COMPARE
Immigrants from Germany
French American Indian
Median Family Income
Median Family Income Comparison
Immigrants from Germany
French American Indians
$105,507
MEDIAN FAMILY INCOME
80.9/ 100
METRIC RATING
149th/ 347
METRIC RANK
$92,872
MEDIAN FAMILY INCOME
0.7/ 100
METRIC RATING
248th/ 347
METRIC RANK
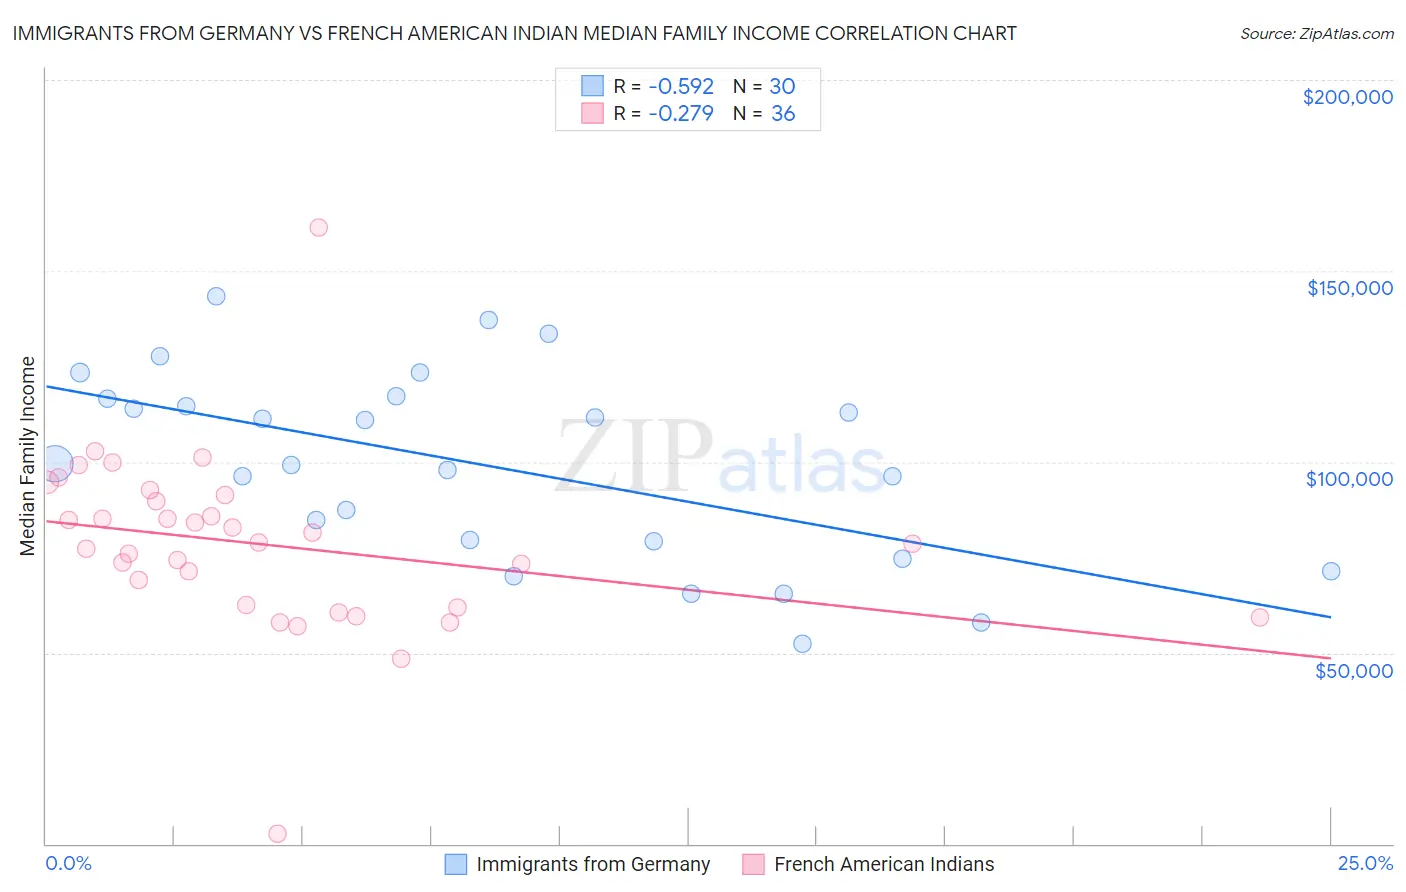
Immigrants from Germany vs French American Indian Median Family Income Correlation Chart
The statistical analysis conducted on geographies consisting of 463,646,337 people shows a substantial negative correlation between the proportion of Immigrants from Germany and median family income in the United States with a correlation coefficient (R) of -0.592 and weighted average of $105,507. Similarly, the statistical analysis conducted on geographies consisting of 131,949,882 people shows a weak negative correlation between the proportion of French American Indians and median family income in the United States with a correlation coefficient (R) of -0.279 and weighted average of $92,872, a difference of 13.6%.
Median Family Income Correlation Summary
| Measurement | Immigrants from Germany | French American Indian |
| Minimum | $52,386 | $2,499 |
| Maximum | $143,516 | $161,250 |
| Range | $91,130 | $158,751 |
| Mean | $99,149 | $78,273 |
| Median | $99,484 | $78,700 |
| Interquartile 25% (IQ1) | $79,167 | $62,262 |
| Interquartile 75% (IQ3) | $116,480 | $90,496 |
| Interquartile Range (IQR) | $37,313 | $28,234 |
| Standard Deviation (Sample) | $24,798 | $23,852 |
| Standard Deviation (Population) | $24,381 | $23,519 |
Similar Demographics by Median Family Income
Demographics Similar to Immigrants from Germany by Median Family Income
In terms of median family income, the demographic groups most similar to Immigrants from Germany are Irish ($105,453, a difference of 0.050%), Peruvian ($105,444, a difference of 0.060%), Hungarian ($105,609, a difference of 0.10%), Immigrants from Chile ($105,655, a difference of 0.14%), and Immigrants from Albania ($105,285, a difference of 0.21%).
| Demographics | Rating | Rank | Median Family Income |
| Slovenes | 84.7 /100 | #142 | Excellent $106,020 |
| Tongans | 84.3 /100 | #143 | Excellent $105,967 |
| Immigrants | Morocco | 84.3 /100 | #144 | Excellent $105,964 |
| Danes | 83.8 /100 | #145 | Excellent $105,900 |
| Czechs | 83.4 /100 | #146 | Excellent $105,839 |
| Immigrants | Chile | 82.1 /100 | #147 | Excellent $105,655 |
| Hungarians | 81.7 /100 | #148 | Excellent $105,609 |
| Immigrants | Germany | 80.9 /100 | #149 | Excellent $105,507 |
| Irish | 80.5 /100 | #150 | Excellent $105,453 |
| Peruvians | 80.4 /100 | #151 | Excellent $105,444 |
| Immigrants | Albania | 79.1 /100 | #152 | Good $105,285 |
| Slavs | 77.9 /100 | #153 | Good $105,144 |
| Immigrants | Nepal | 76.3 /100 | #154 | Good $104,966 |
| Native Hawaiians | 75.8 /100 | #155 | Good $104,910 |
| Basques | 74.4 /100 | #156 | Good $104,760 |
Demographics Similar to French American Indians by Median Family Income
In terms of median family income, the demographic groups most similar to French American Indians are Immigrants from Senegal ($92,912, a difference of 0.040%), Immigrants from Ecuador ($92,837, a difference of 0.040%), West Indian ($92,765, a difference of 0.11%), Immigrants from Somalia ($92,609, a difference of 0.28%), and Immigrants from El Salvador ($92,545, a difference of 0.35%).
| Demographics | Rating | Rank | Median Family Income |
| Immigrants | Trinidad and Tobago | 1.2 /100 | #241 | Tragic $93,988 |
| Barbadians | 1.1 /100 | #242 | Tragic $93,919 |
| German Russians | 1.1 /100 | #243 | Tragic $93,858 |
| Sub-Saharan Africans | 1.0 /100 | #244 | Tragic $93,748 |
| Immigrants | Middle Africa | 1.0 /100 | #245 | Tragic $93,593 |
| Guyanese | 0.9 /100 | #246 | Tragic $93,373 |
| Immigrants | Senegal | 0.7 /100 | #247 | Tragic $92,912 |
| French American Indians | 0.7 /100 | #248 | Tragic $92,872 |
| Immigrants | Ecuador | 0.7 /100 | #249 | Tragic $92,837 |
| West Indians | 0.6 /100 | #250 | Tragic $92,765 |
| Immigrants | Somalia | 0.6 /100 | #251 | Tragic $92,609 |
| Immigrants | El Salvador | 0.6 /100 | #252 | Tragic $92,545 |
| Immigrants | Guyana | 0.6 /100 | #253 | Tragic $92,513 |
| Immigrants | Barbados | 0.5 /100 | #254 | Tragic $92,419 |
| Immigrants | Laos | 0.5 /100 | #255 | Tragic $92,239 |