Jamaican vs French American Indian Unemployment Among Ages 20 to 24 years
COMPARE
Jamaican
French American Indian
Unemployment Among Ages 20 to 24 years
Unemployment Among Ages 20 to 24 years Comparison
Jamaicans
French American Indians
12.6%
UNEMPLOYMENT AMONG AGES 20 TO 24 YEARS
0.0/ 100
METRIC RATING
310th/ 347
METRIC RANK
10.6%
UNEMPLOYMENT AMONG AGES 20 TO 24 YEARS
4.1/ 100
METRIC RATING
230th/ 347
METRIC RANK
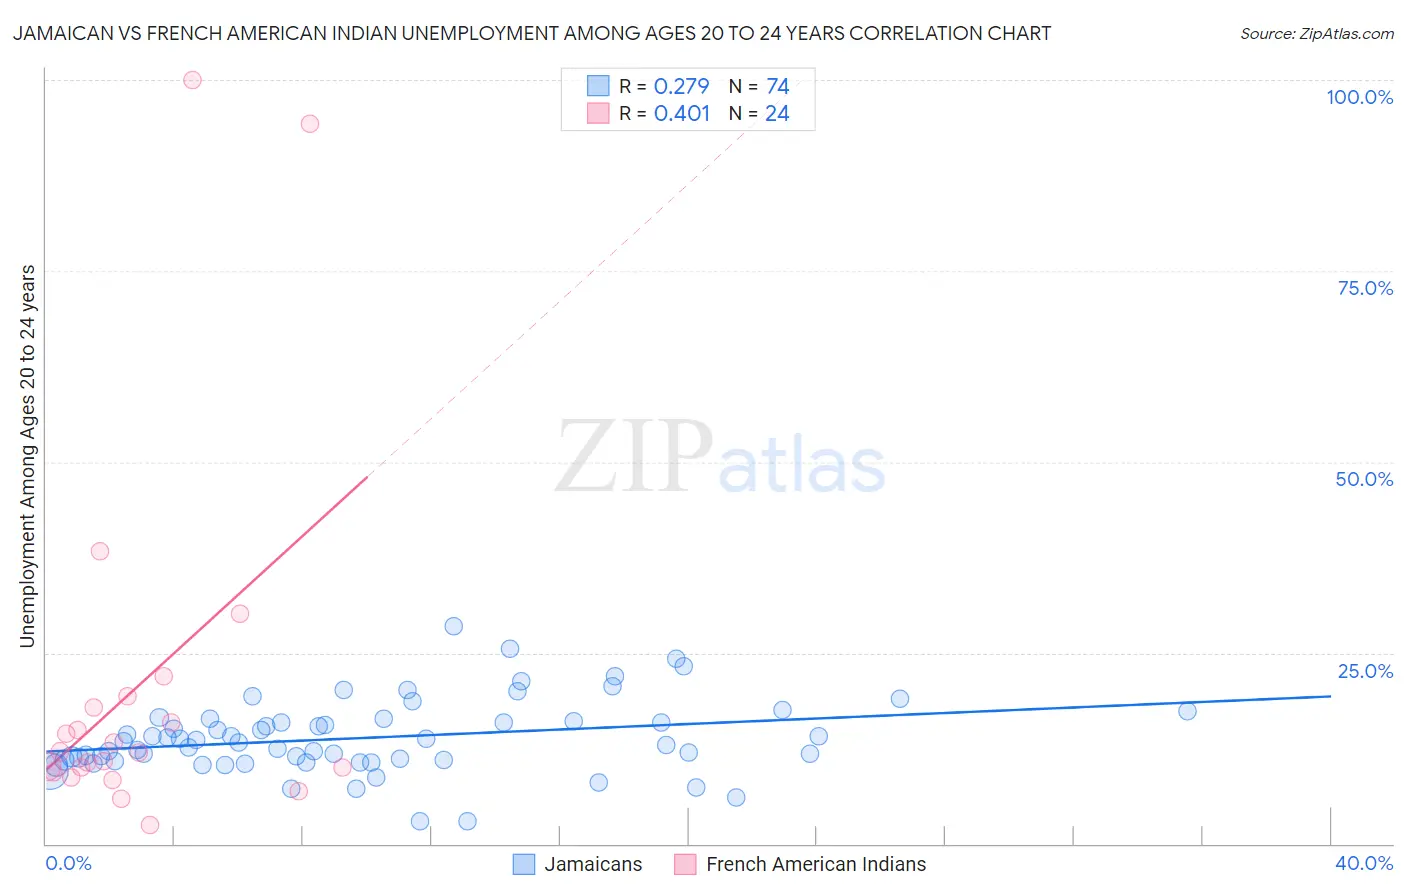
Jamaican vs French American Indian Unemployment Among Ages 20 to 24 years Correlation Chart
The statistical analysis conducted on geographies consisting of 359,144,305 people shows a weak positive correlation between the proportion of Jamaicans and unemployment rate among population between the ages 20 and 24 in the United States with a correlation coefficient (R) of 0.279 and weighted average of 12.6%. Similarly, the statistical analysis conducted on geographies consisting of 129,532,649 people shows a moderate positive correlation between the proportion of French American Indians and unemployment rate among population between the ages 20 and 24 in the United States with a correlation coefficient (R) of 0.401 and weighted average of 10.6%, a difference of 18.5%.
Unemployment Among Ages 20 to 24 years Correlation Summary
| Measurement | Jamaican | French American Indian |
| Minimum | 3.0% | 2.4% |
| Maximum | 28.4% | 100.0% |
| Range | 25.4% | 97.6% |
| Mean | 13.9% | 20.7% |
| Median | 13.4% | 12.0% |
| Interquartile 25% (IQ1) | 10.9% | 9.7% |
| Interquartile 75% (IQ3) | 16.0% | 18.6% |
| Interquartile Range (IQR) | 5.1% | 8.9% |
| Standard Deviation (Sample) | 4.8% | 24.8% |
| Standard Deviation (Population) | 4.7% | 24.3% |
Similar Demographics by Unemployment Among Ages 20 to 24 years
Demographics Similar to Jamaicans by Unemployment Among Ages 20 to 24 years
In terms of unemployment among ages 20 to 24 years, the demographic groups most similar to Jamaicans are Immigrants from Bangladesh (12.6%, a difference of 0.12%), Tohono O'odham (12.5%, a difference of 0.20%), Vietnamese (12.6%, a difference of 0.44%), Houma (12.6%, a difference of 0.59%), and Bermudan (12.5%, a difference of 0.89%).
| Demographics | Rating | Rank | Unemployment Among Ages 20 to 24 years |
| Haitians | 0.0 /100 | #303 | Tragic 12.2% |
| Immigrants | West Indies | 0.0 /100 | #304 | Tragic 12.3% |
| Chippewa | 0.0 /100 | #305 | Tragic 12.3% |
| Immigrants | Haiti | 0.0 /100 | #306 | Tragic 12.4% |
| Bermudans | 0.0 /100 | #307 | Tragic 12.5% |
| Tohono O'odham | 0.0 /100 | #308 | Tragic 12.5% |
| Immigrants | Bangladesh | 0.0 /100 | #309 | Tragic 12.6% |
| Jamaicans | 0.0 /100 | #310 | Tragic 12.6% |
| Vietnamese | 0.0 /100 | #311 | Tragic 12.6% |
| Houma | 0.0 /100 | #312 | Tragic 12.6% |
| Shoshone | 0.0 /100 | #313 | Tragic 12.7% |
| Blacks/African Americans | 0.0 /100 | #314 | Tragic 12.7% |
| West Indians | 0.0 /100 | #315 | Tragic 12.8% |
| Immigrants | Dominica | 0.0 /100 | #316 | Tragic 12.8% |
| Immigrants | Trinidad and Tobago | 0.0 /100 | #317 | Tragic 12.8% |
Demographics Similar to French American Indians by Unemployment Among Ages 20 to 24 years
In terms of unemployment among ages 20 to 24 years, the demographic groups most similar to French American Indians are Native Hawaiian (10.6%, a difference of 0.050%), American (10.6%, a difference of 0.060%), Mexican American Indian (10.6%, a difference of 0.10%), Israeli (10.6%, a difference of 0.11%), and Choctaw (10.6%, a difference of 0.13%).
| Demographics | Rating | Rank | Unemployment Among Ages 20 to 24 years |
| Arabs | 5.6 /100 | #223 | Tragic 10.6% |
| Nepalese | 5.1 /100 | #224 | Tragic 10.6% |
| Immigrants | South America | 5.1 /100 | #225 | Tragic 10.6% |
| Immigrants | Costa Rica | 4.9 /100 | #226 | Tragic 10.6% |
| Palestinians | 4.9 /100 | #227 | Tragic 10.6% |
| Mexican American Indians | 4.6 /100 | #228 | Tragic 10.6% |
| Americans | 4.4 /100 | #229 | Tragic 10.6% |
| French American Indians | 4.1 /100 | #230 | Tragic 10.6% |
| Native Hawaiians | 3.9 /100 | #231 | Tragic 10.6% |
| Israelis | 3.7 /100 | #232 | Tragic 10.6% |
| Choctaw | 3.6 /100 | #233 | Tragic 10.6% |
| Immigrants | Africa | 3.5 /100 | #234 | Tragic 10.6% |
| Immigrants | Ukraine | 3.3 /100 | #235 | Tragic 10.6% |
| Mexicans | 3.2 /100 | #236 | Tragic 10.6% |
| Immigrants | Immigrants | 2.7 /100 | #237 | Tragic 10.6% |