Israeli vs Cuban Median Earnings
COMPARE
Israeli
Cuban
Median Earnings
Median Earnings Comparison
Israelis
Cubans
$52,937
MEDIAN EARNINGS
100.0/ 100
METRIC RATING
40th/ 347
METRIC RANK
$40,619
MEDIAN EARNINGS
0.0/ 100
METRIC RATING
308th/ 347
METRIC RANK
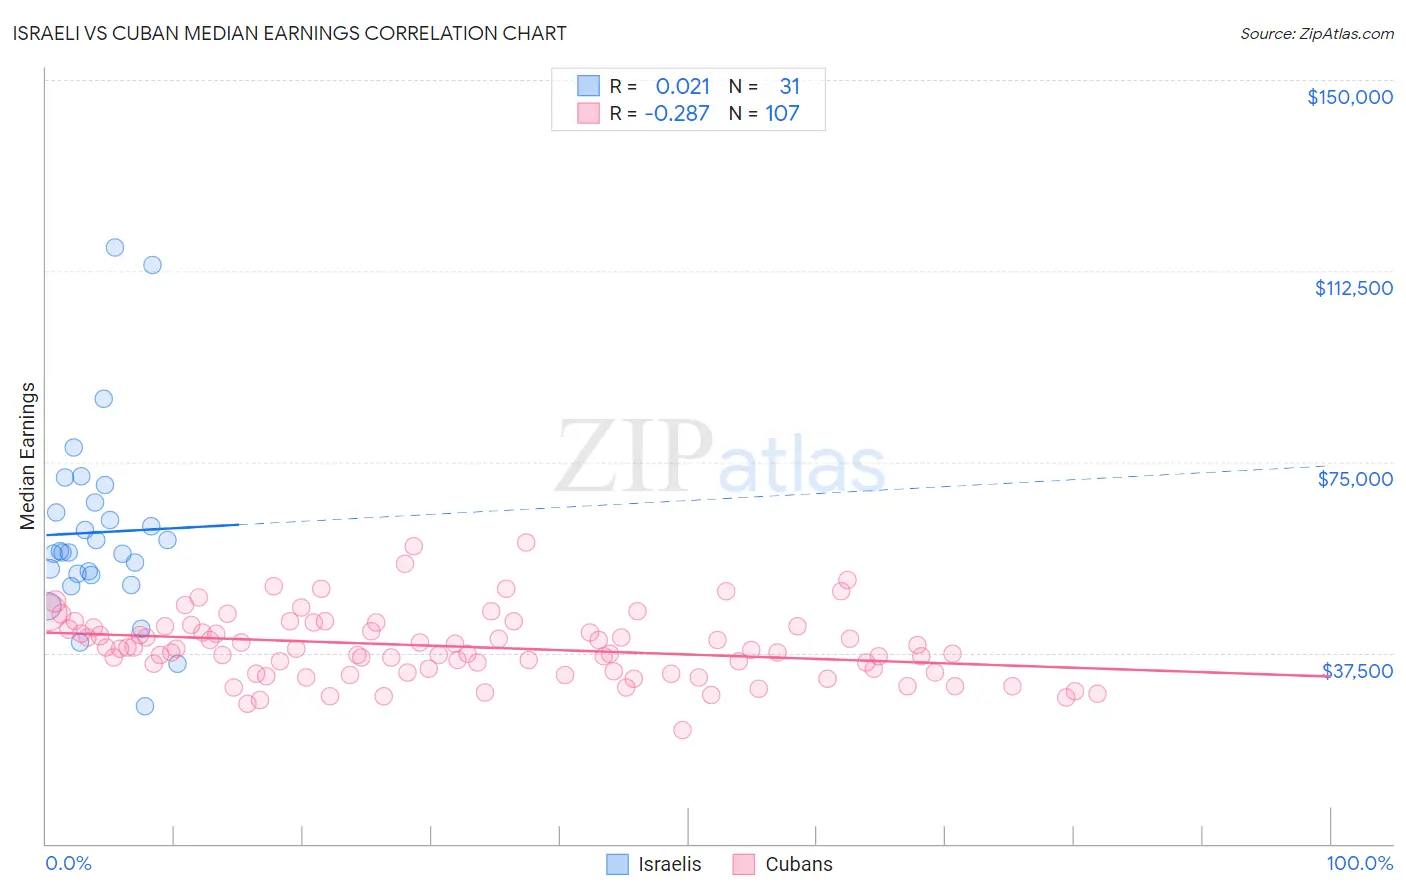
Israeli vs Cuban Median Earnings Correlation Chart
The statistical analysis conducted on geographies consisting of 211,215,841 people shows no correlation between the proportion of Israelis and median earnings in the United States with a correlation coefficient (R) of 0.021 and weighted average of $52,937. Similarly, the statistical analysis conducted on geographies consisting of 449,351,529 people shows a weak negative correlation between the proportion of Cubans and median earnings in the United States with a correlation coefficient (R) of -0.287 and weighted average of $40,619, a difference of 30.3%.
Median Earnings Correlation Summary
| Measurement | Israeli | Cuban |
| Minimum | $27,000 | $22,371 |
| Maximum | $117,019 | $59,236 |
| Range | $90,019 | $36,865 |
| Mean | $61,168 | $38,708 |
| Median | $57,256 | $38,230 |
| Interquartile 25% (IQ1) | $52,851 | $33,586 |
| Interquartile 75% (IQ3) | $67,052 | $42,663 |
| Interquartile Range (IQR) | $14,202 | $9,077 |
| Standard Deviation (Sample) | $18,863 | $6,670 |
| Standard Deviation (Population) | $18,557 | $6,639 |
Similar Demographics by Median Earnings
Demographics Similar to Israelis by Median Earnings
In terms of median earnings, the demographic groups most similar to Israelis are Immigrants from Turkey ($52,960, a difference of 0.040%), Latvian ($53,001, a difference of 0.12%), Immigrants from Belarus ($53,043, a difference of 0.20%), Immigrants from Lithuania ($52,769, a difference of 0.32%), and Immigrants from Denmark ($53,186, a difference of 0.47%).
| Demographics | Rating | Rank | Median Earnings |
| Immigrants | Greece | 100.0 /100 | #33 | Exceptional $53,282 |
| Immigrants | Sri Lanka | 100.0 /100 | #34 | Exceptional $53,268 |
| Immigrants | Switzerland | 100.0 /100 | #35 | Exceptional $53,211 |
| Immigrants | Denmark | 100.0 /100 | #36 | Exceptional $53,186 |
| Immigrants | Belarus | 100.0 /100 | #37 | Exceptional $53,043 |
| Latvians | 100.0 /100 | #38 | Exceptional $53,001 |
| Immigrants | Turkey | 100.0 /100 | #39 | Exceptional $52,960 |
| Israelis | 100.0 /100 | #40 | Exceptional $52,937 |
| Immigrants | Lithuania | 100.0 /100 | #41 | Exceptional $52,769 |
| Maltese | 100.0 /100 | #42 | Exceptional $52,526 |
| Immigrants | Malaysia | 100.0 /100 | #43 | Exceptional $52,514 |
| Bulgarians | 100.0 /100 | #44 | Exceptional $52,512 |
| Immigrants | Czechoslovakia | 100.0 /100 | #45 | Exceptional $52,361 |
| Bhutanese | 100.0 /100 | #46 | Exceptional $52,297 |
| Australians | 100.0 /100 | #47 | Exceptional $52,294 |
Demographics Similar to Cubans by Median Earnings
In terms of median earnings, the demographic groups most similar to Cubans are Honduran ($40,638, a difference of 0.050%), Yaqui ($40,647, a difference of 0.070%), Chickasaw ($40,672, a difference of 0.13%), Immigrants from Haiti ($40,550, a difference of 0.17%), and Immigrants from Guatemala ($40,851, a difference of 0.57%).
| Demographics | Rating | Rank | Median Earnings |
| Immigrants | Latin America | 0.1 /100 | #301 | Tragic $41,049 |
| Shoshone | 0.0 /100 | #302 | Tragic $40,932 |
| Haitians | 0.0 /100 | #303 | Tragic $40,918 |
| Immigrants | Guatemala | 0.0 /100 | #304 | Tragic $40,851 |
| Chickasaw | 0.0 /100 | #305 | Tragic $40,672 |
| Yaqui | 0.0 /100 | #306 | Tragic $40,647 |
| Hondurans | 0.0 /100 | #307 | Tragic $40,638 |
| Cubans | 0.0 /100 | #308 | Tragic $40,619 |
| Immigrants | Haiti | 0.0 /100 | #309 | Tragic $40,550 |
| Apache | 0.0 /100 | #310 | Tragic $40,388 |
| Hispanics or Latinos | 0.0 /100 | #311 | Tragic $40,288 |
| Chippewa | 0.0 /100 | #312 | Tragic $40,287 |
| Choctaw | 0.0 /100 | #313 | Tragic $40,270 |
| Cheyenne | 0.0 /100 | #314 | Tragic $40,233 |
| Seminole | 0.0 /100 | #315 | Tragic $40,233 |