Ethiopian vs Cuban Median Earnings
COMPARE
Ethiopian
Cuban
Median Earnings
Median Earnings Comparison
Ethiopians
Cubans
$49,572
MEDIAN EARNINGS
98.8/ 100
METRIC RATING
102nd/ 347
METRIC RANK
$40,619
MEDIAN EARNINGS
0.0/ 100
METRIC RATING
308th/ 347
METRIC RANK
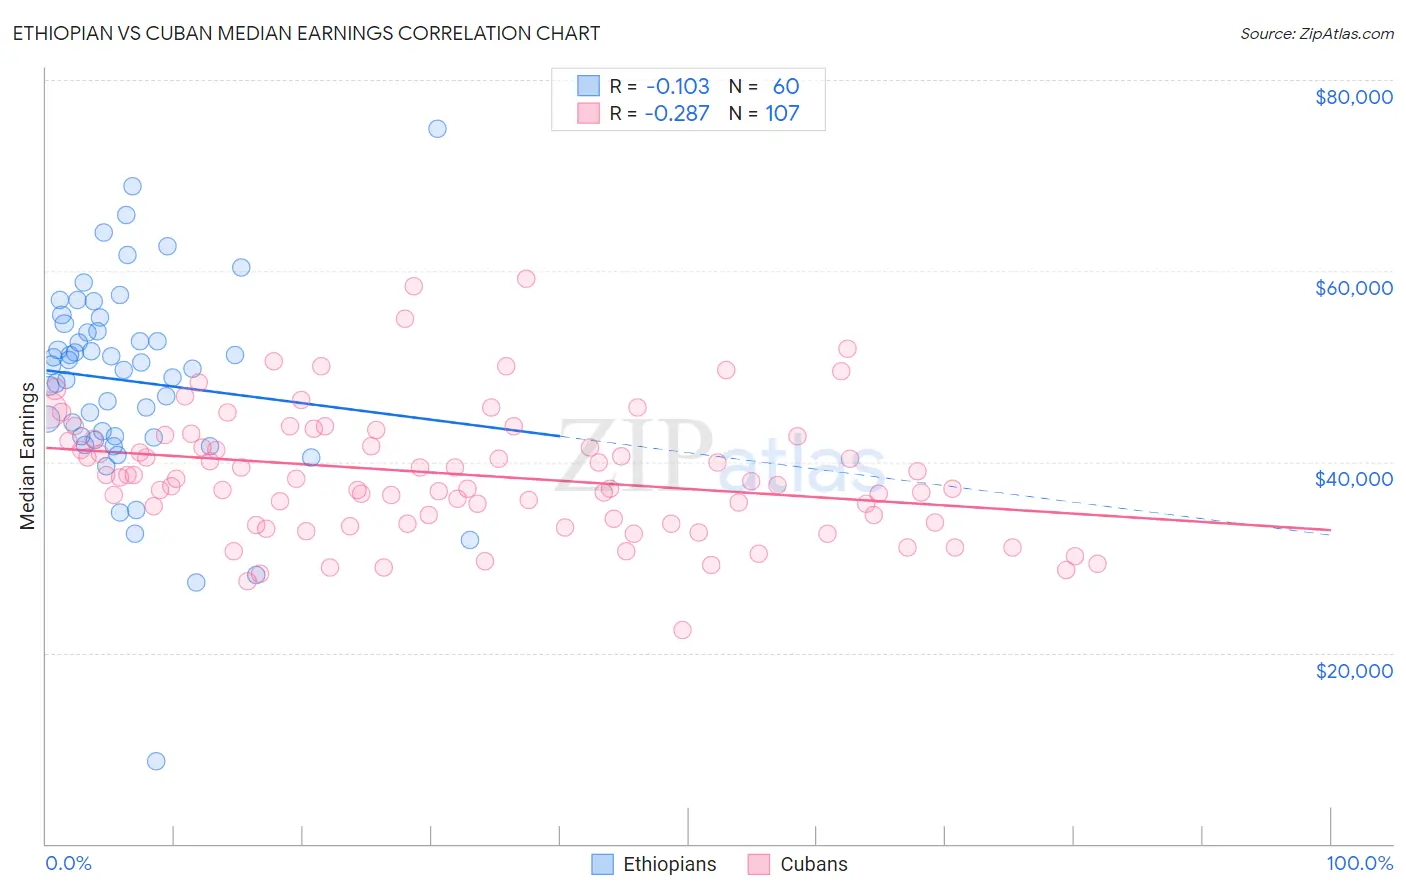
Ethiopian vs Cuban Median Earnings Correlation Chart
The statistical analysis conducted on geographies consisting of 223,260,849 people shows a poor negative correlation between the proportion of Ethiopians and median earnings in the United States with a correlation coefficient (R) of -0.103 and weighted average of $49,572. Similarly, the statistical analysis conducted on geographies consisting of 449,351,529 people shows a weak negative correlation between the proportion of Cubans and median earnings in the United States with a correlation coefficient (R) of -0.287 and weighted average of $40,619, a difference of 22.0%.
Median Earnings Correlation Summary
| Measurement | Ethiopian | Cuban |
| Minimum | $8,623 | $22,371 |
| Maximum | $74,844 | $59,236 |
| Range | $66,221 | $36,865 |
| Mean | $48,479 | $38,708 |
| Median | $49,984 | $38,230 |
| Interquartile 25% (IQ1) | $42,620 | $33,586 |
| Interquartile 75% (IQ3) | $54,089 | $42,663 |
| Interquartile Range (IQR) | $11,470 | $9,077 |
| Standard Deviation (Sample) | $10,733 | $6,670 |
| Standard Deviation (Population) | $10,643 | $6,639 |
Similar Demographics by Median Earnings
Demographics Similar to Ethiopians by Median Earnings
In terms of median earnings, the demographic groups most similar to Ethiopians are Immigrants from Poland ($49,633, a difference of 0.12%), Jordanian ($49,632, a difference of 0.12%), Austrian ($49,501, a difference of 0.14%), Immigrants from Northern Africa ($49,648, a difference of 0.15%), and Immigrants from Afghanistan ($49,645, a difference of 0.15%).
| Demographics | Rating | Rank | Median Earnings |
| Immigrants | England | 99.0 /100 | #95 | Exceptional $49,722 |
| Immigrants | Lebanon | 99.0 /100 | #96 | Exceptional $49,682 |
| Immigrants | North Macedonia | 98.9 /100 | #97 | Exceptional $49,658 |
| Immigrants | Northern Africa | 98.9 /100 | #98 | Exceptional $49,648 |
| Immigrants | Afghanistan | 98.9 /100 | #99 | Exceptional $49,645 |
| Immigrants | Poland | 98.9 /100 | #100 | Exceptional $49,633 |
| Jordanians | 98.9 /100 | #101 | Exceptional $49,632 |
| Ethiopians | 98.8 /100 | #102 | Exceptional $49,572 |
| Austrians | 98.7 /100 | #103 | Exceptional $49,501 |
| Immigrants | Brazil | 98.6 /100 | #104 | Exceptional $49,463 |
| Immigrants | Western Asia | 98.4 /100 | #105 | Exceptional $49,389 |
| Immigrants | Albania | 98.4 /100 | #106 | Exceptional $49,377 |
| Immigrants | Morocco | 98.4 /100 | #107 | Exceptional $49,368 |
| Palestinians | 98.0 /100 | #108 | Exceptional $49,209 |
| Syrians | 97.1 /100 | #109 | Exceptional $48,934 |
Demographics Similar to Cubans by Median Earnings
In terms of median earnings, the demographic groups most similar to Cubans are Honduran ($40,638, a difference of 0.050%), Yaqui ($40,647, a difference of 0.070%), Chickasaw ($40,672, a difference of 0.13%), Immigrants from Haiti ($40,550, a difference of 0.17%), and Immigrants from Guatemala ($40,851, a difference of 0.57%).
| Demographics | Rating | Rank | Median Earnings |
| Immigrants | Latin America | 0.1 /100 | #301 | Tragic $41,049 |
| Shoshone | 0.0 /100 | #302 | Tragic $40,932 |
| Haitians | 0.0 /100 | #303 | Tragic $40,918 |
| Immigrants | Guatemala | 0.0 /100 | #304 | Tragic $40,851 |
| Chickasaw | 0.0 /100 | #305 | Tragic $40,672 |
| Yaqui | 0.0 /100 | #306 | Tragic $40,647 |
| Hondurans | 0.0 /100 | #307 | Tragic $40,638 |
| Cubans | 0.0 /100 | #308 | Tragic $40,619 |
| Immigrants | Haiti | 0.0 /100 | #309 | Tragic $40,550 |
| Apache | 0.0 /100 | #310 | Tragic $40,388 |
| Hispanics or Latinos | 0.0 /100 | #311 | Tragic $40,288 |
| Chippewa | 0.0 /100 | #312 | Tragic $40,287 |
| Choctaw | 0.0 /100 | #313 | Tragic $40,270 |
| Cheyenne | 0.0 /100 | #314 | Tragic $40,233 |
| Seminole | 0.0 /100 | #315 | Tragic $40,233 |