Israeli vs Cuban Ambulatory Disability
COMPARE
Israeli
Cuban
Ambulatory Disability
Ambulatory Disability Comparison
Israelis
Cubans
5.7%
AMBULATORY DISABILITY
99.6/ 100
METRIC RATING
66th/ 347
METRIC RANK
6.4%
AMBULATORY DISABILITY
4.0/ 100
METRIC RATING
227th/ 347
METRIC RANK
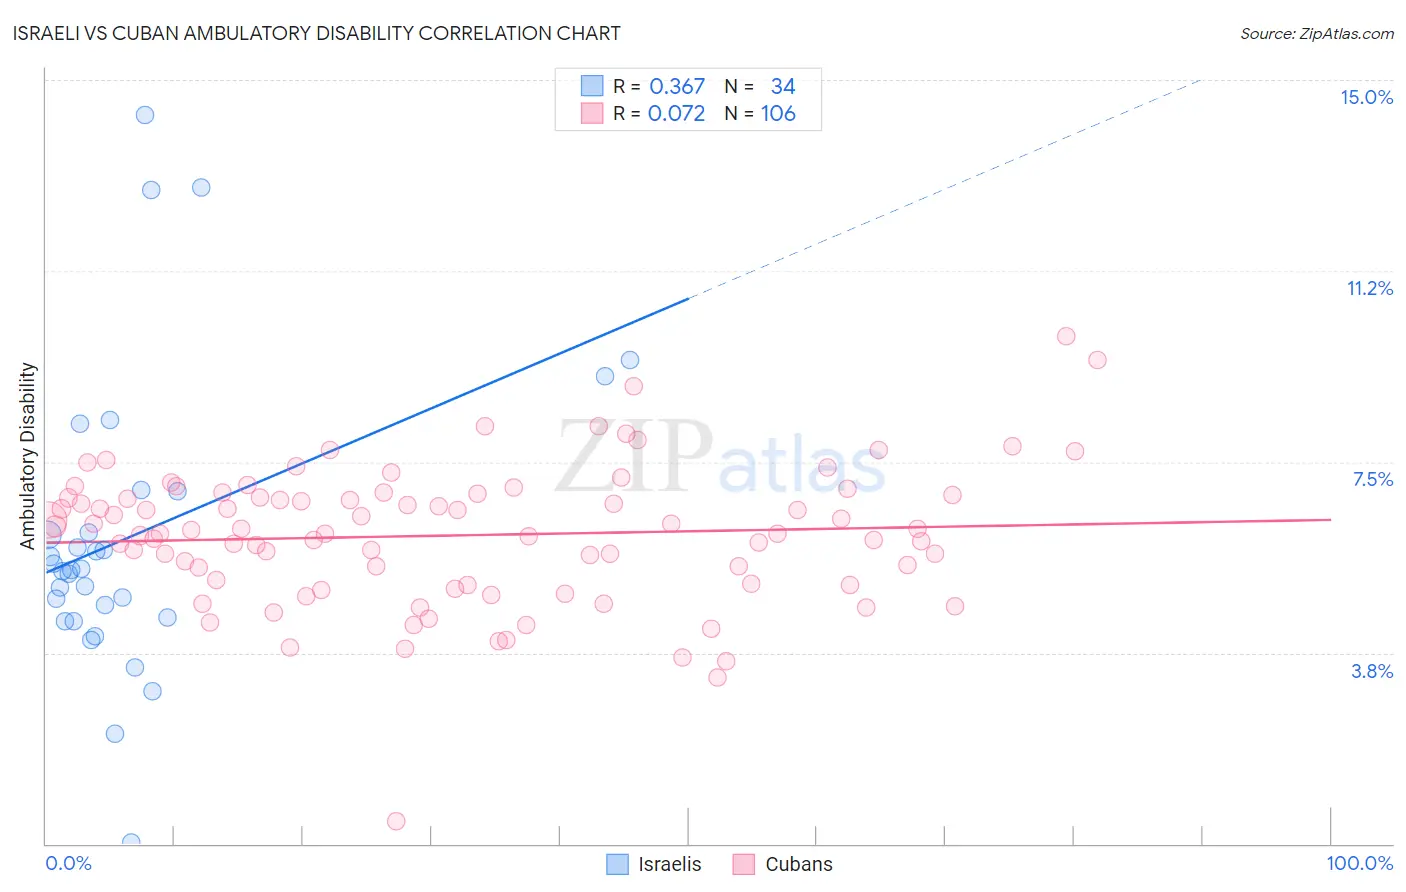
Israeli vs Cuban Ambulatory Disability Correlation Chart
The statistical analysis conducted on geographies consisting of 211,116,012 people shows a mild positive correlation between the proportion of Israelis and percentage of population with ambulatory disability in the United States with a correlation coefficient (R) of 0.367 and weighted average of 5.7%. Similarly, the statistical analysis conducted on geographies consisting of 449,114,501 people shows a slight positive correlation between the proportion of Cubans and percentage of population with ambulatory disability in the United States with a correlation coefficient (R) of 0.072 and weighted average of 6.4%, a difference of 12.6%.
Ambulatory Disability Correlation Summary
| Measurement | Israeli | Cuban |
| Minimum | 0.023% | 0.45% |
| Maximum | 14.3% | 10.0% |
| Range | 14.3% | 9.5% |
| Mean | 6.0% | 6.1% |
| Median | 5.4% | 6.1% |
| Interquartile 25% (IQ1) | 4.4% | 5.1% |
| Interquartile 75% (IQ3) | 6.9% | 6.9% |
| Interquartile Range (IQR) | 2.5% | 1.7% |
| Standard Deviation (Sample) | 3.0% | 1.4% |
| Standard Deviation (Population) | 2.9% | 1.4% |
Similar Demographics by Ambulatory Disability
Demographics Similar to Israelis by Ambulatory Disability
In terms of ambulatory disability, the demographic groups most similar to Israelis are Immigrants from Uganda (5.7%, a difference of 0.010%), Sri Lankan (5.7%, a difference of 0.040%), Immigrants from Switzerland (5.7%, a difference of 0.090%), Laotian (5.7%, a difference of 0.12%), and Immigrants from France (5.6%, a difference of 0.25%).
| Demographics | Rating | Rank | Ambulatory Disability |
| Immigrants | Afghanistan | 99.8 /100 | #59 | Exceptional 5.6% |
| Immigrants | Lithuania | 99.8 /100 | #60 | Exceptional 5.6% |
| Immigrants | Belgium | 99.7 /100 | #61 | Exceptional 5.6% |
| Immigrants | Spain | 99.7 /100 | #62 | Exceptional 5.6% |
| Immigrants | France | 99.7 /100 | #63 | Exceptional 5.6% |
| Laotians | 99.7 /100 | #64 | Exceptional 5.7% |
| Immigrants | Switzerland | 99.7 /100 | #65 | Exceptional 5.7% |
| Israelis | 99.6 /100 | #66 | Exceptional 5.7% |
| Immigrants | Uganda | 99.6 /100 | #67 | Exceptional 5.7% |
| Sri Lankans | 99.6 /100 | #68 | Exceptional 5.7% |
| Peruvians | 99.5 /100 | #69 | Exceptional 5.7% |
| Sierra Leoneans | 99.4 /100 | #70 | Exceptional 5.7% |
| Immigrants | Peru | 99.4 /100 | #71 | Exceptional 5.7% |
| Brazilians | 99.4 /100 | #72 | Exceptional 5.7% |
| Immigrants | Northern Africa | 99.4 /100 | #73 | Exceptional 5.7% |
Demographics Similar to Cubans by Ambulatory Disability
In terms of ambulatory disability, the demographic groups most similar to Cubans are Portuguese (6.4%, a difference of 0.010%), Czechoslovakian (6.4%, a difference of 0.060%), Mexican (6.4%, a difference of 0.17%), Panamanian (6.4%, a difference of 0.32%), and Slavic (6.4%, a difference of 0.33%).
| Demographics | Rating | Rank | Ambulatory Disability |
| Immigrants | Albania | 9.6 /100 | #220 | Tragic 6.3% |
| Hungarians | 9.6 /100 | #221 | Tragic 6.3% |
| German Russians | 9.4 /100 | #222 | Tragic 6.3% |
| Immigrants | Honduras | 7.6 /100 | #223 | Tragic 6.3% |
| Liberians | 7.1 /100 | #224 | Tragic 6.3% |
| Hondurans | 6.3 /100 | #225 | Tragic 6.3% |
| Slavs | 5.1 /100 | #226 | Tragic 6.4% |
| Cubans | 4.0 /100 | #227 | Tragic 6.4% |
| Portuguese | 4.0 /100 | #228 | Tragic 6.4% |
| Czechoslovakians | 3.8 /100 | #229 | Tragic 6.4% |
| Mexicans | 3.5 /100 | #230 | Tragic 6.4% |
| Panamanians | 3.1 /100 | #231 | Tragic 6.4% |
| Assyrians/Chaldeans/Syriacs | 2.4 /100 | #232 | Tragic 6.4% |
| Sub-Saharan Africans | 2.3 /100 | #233 | Tragic 6.4% |
| Immigrants | Liberia | 2.3 /100 | #234 | Tragic 6.4% |