Israeli vs Turkish Median Earnings
COMPARE
Israeli
Turkish
Median Earnings
Median Earnings Comparison
Israelis
Turks
$52,937
MEDIAN EARNINGS
100.0/ 100
METRIC RATING
40th/ 347
METRIC RANK
$53,919
MEDIAN EARNINGS
100.0/ 100
METRIC RATING
25th/ 347
METRIC RANK
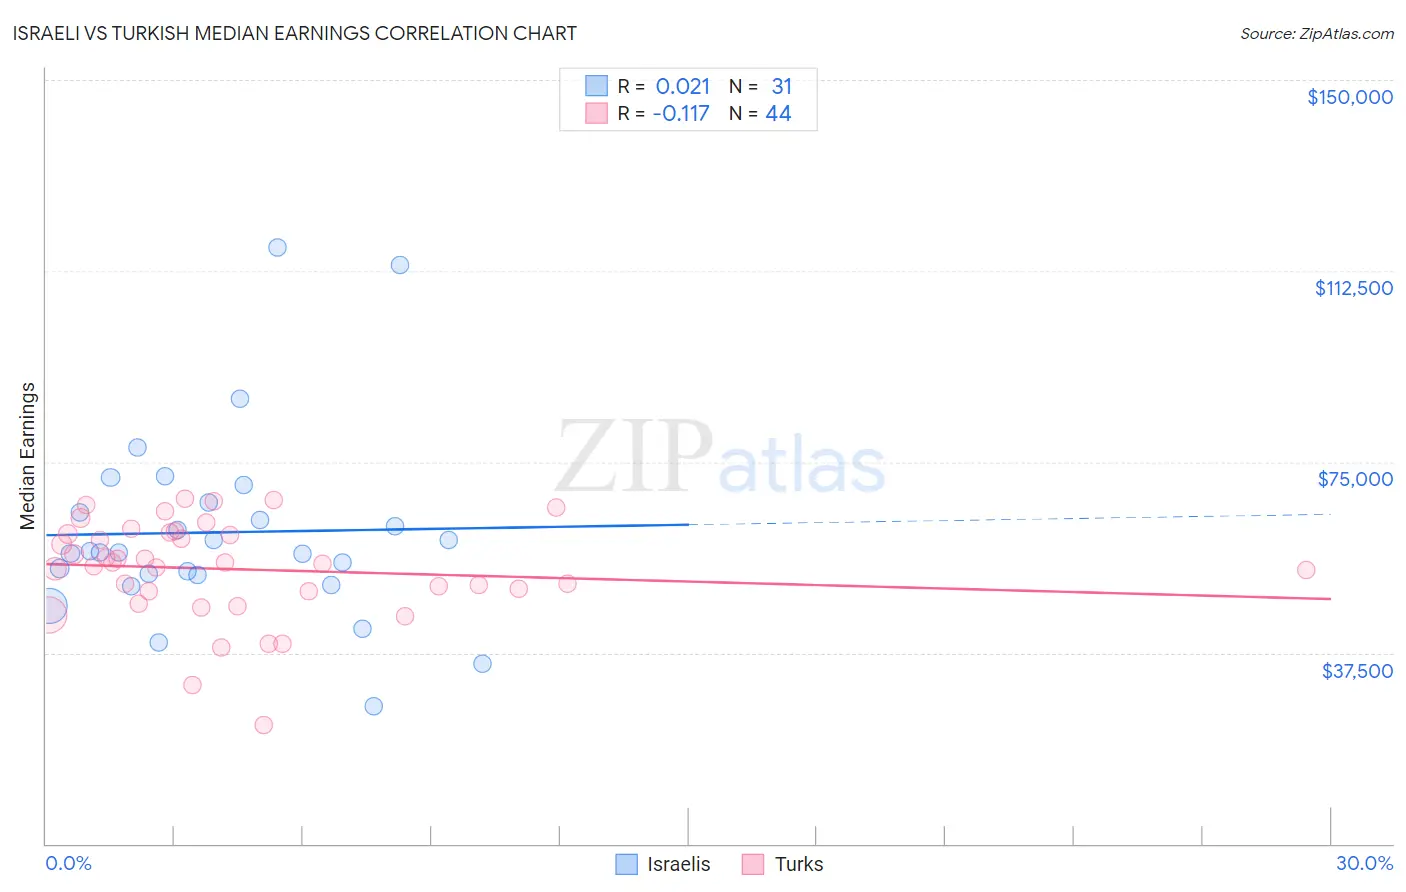
Israeli vs Turkish Median Earnings Correlation Chart
The statistical analysis conducted on geographies consisting of 211,215,841 people shows no correlation between the proportion of Israelis and median earnings in the United States with a correlation coefficient (R) of 0.021 and weighted average of $52,937. Similarly, the statistical analysis conducted on geographies consisting of 271,840,547 people shows a poor negative correlation between the proportion of Turks and median earnings in the United States with a correlation coefficient (R) of -0.117 and weighted average of $53,919, a difference of 1.8%.
Median Earnings Correlation Summary
| Measurement | Israeli | Turkish |
| Minimum | $27,000 | $23,333 |
| Maximum | $117,019 | $67,805 |
| Range | $90,019 | $44,472 |
| Mean | $61,168 | $53,919 |
| Median | $57,256 | $55,155 |
| Interquartile 25% (IQ1) | $52,851 | $49,523 |
| Interquartile 75% (IQ3) | $67,052 | $60,942 |
| Interquartile Range (IQR) | $14,202 | $11,419 |
| Standard Deviation (Sample) | $18,863 | $9,775 |
| Standard Deviation (Population) | $18,557 | $9,664 |
Demographics Similar to Israelis and Turks by Median Earnings
In terms of median earnings, the demographic groups most similar to Israelis are Immigrants from Turkey ($52,960, a difference of 0.040%), Latvian ($53,001, a difference of 0.12%), Immigrants from Belarus ($53,043, a difference of 0.20%), Immigrants from Lithuania ($52,769, a difference of 0.32%), and Immigrants from Denmark ($53,186, a difference of 0.47%). Similarly, the demographic groups most similar to Turks are Immigrants from Northern Europe ($53,872, a difference of 0.090%), Asian ($53,690, a difference of 0.43%), Soviet Union ($54,290, a difference of 0.69%), Immigrants from France ($53,490, a difference of 0.80%), and Immigrants from Russia ($53,457, a difference of 0.86%).
| Demographics | Rating | Rank | Median Earnings |
| Immigrants | Korea | 100.0 /100 | #22 | Exceptional $54,530 |
| Immigrants | Sweden | 100.0 /100 | #23 | Exceptional $54,478 |
| Soviet Union | 100.0 /100 | #24 | Exceptional $54,290 |
| Turks | 100.0 /100 | #25 | Exceptional $53,919 |
| Immigrants | Northern Europe | 100.0 /100 | #26 | Exceptional $53,872 |
| Asians | 100.0 /100 | #27 | Exceptional $53,690 |
| Immigrants | France | 100.0 /100 | #28 | Exceptional $53,490 |
| Immigrants | Russia | 100.0 /100 | #29 | Exceptional $53,457 |
| Cambodians | 100.0 /100 | #30 | Exceptional $53,386 |
| Russians | 100.0 /100 | #31 | Exceptional $53,334 |
| Immigrants | Asia | 100.0 /100 | #32 | Exceptional $53,310 |
| Immigrants | Greece | 100.0 /100 | #33 | Exceptional $53,282 |
| Immigrants | Sri Lanka | 100.0 /100 | #34 | Exceptional $53,268 |
| Immigrants | Switzerland | 100.0 /100 | #35 | Exceptional $53,211 |
| Immigrants | Denmark | 100.0 /100 | #36 | Exceptional $53,186 |
| Immigrants | Belarus | 100.0 /100 | #37 | Exceptional $53,043 |
| Latvians | 100.0 /100 | #38 | Exceptional $53,001 |
| Immigrants | Turkey | 100.0 /100 | #39 | Exceptional $52,960 |
| Israelis | 100.0 /100 | #40 | Exceptional $52,937 |
| Immigrants | Lithuania | 100.0 /100 | #41 | Exceptional $52,769 |
| Maltese | 100.0 /100 | #42 | Exceptional $52,526 |