Immigrants from Russia vs Cuban Median Earnings
COMPARE
Immigrants from Russia
Cuban
Median Earnings
Median Earnings Comparison
Immigrants from Russia
Cubans
$53,457
MEDIAN EARNINGS
100.0/ 100
METRIC RATING
29th/ 347
METRIC RANK
$40,619
MEDIAN EARNINGS
0.0/ 100
METRIC RATING
308th/ 347
METRIC RANK
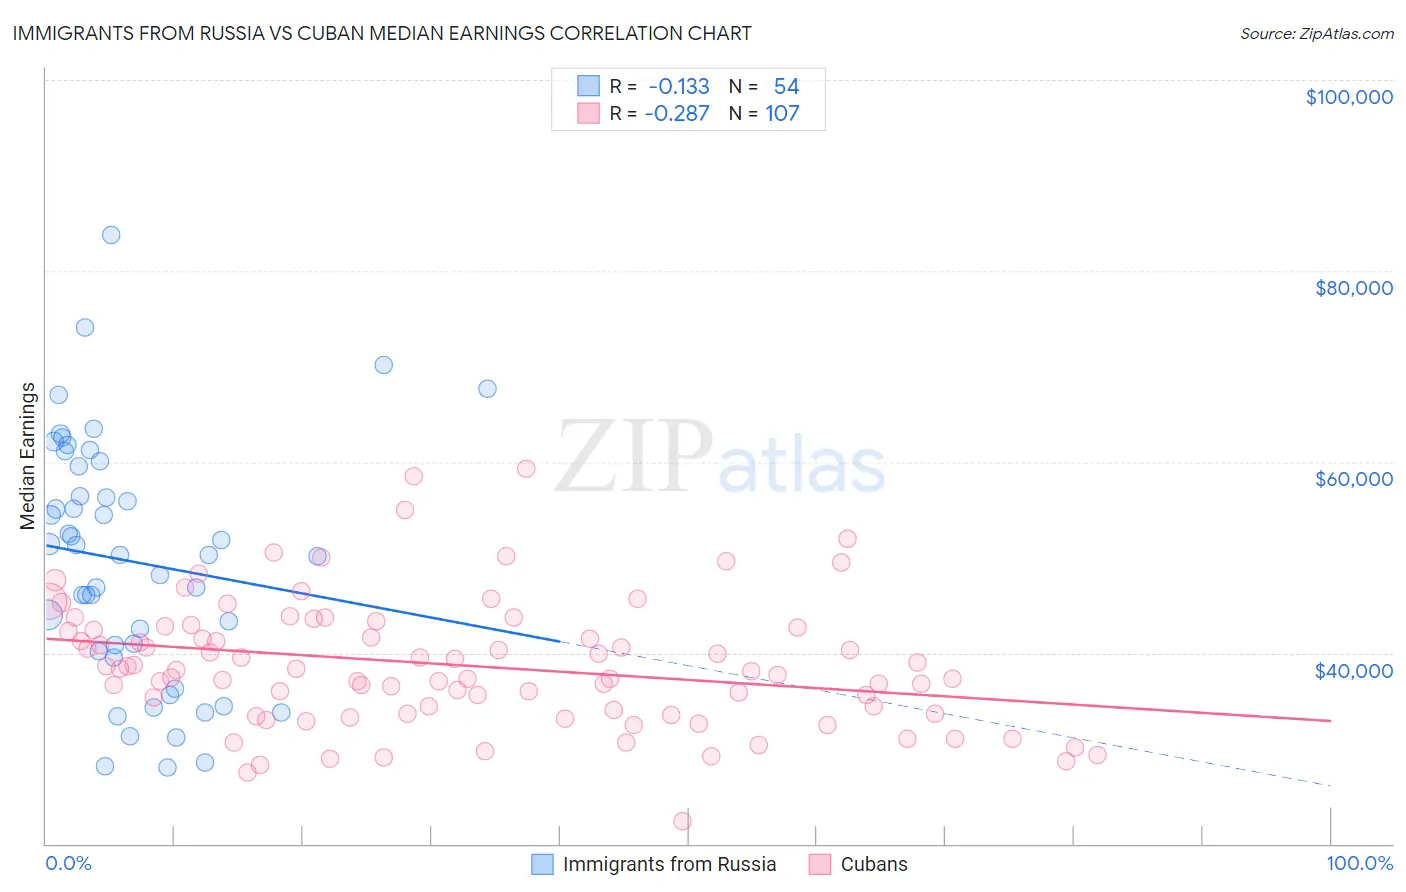
Immigrants from Russia vs Cuban Median Earnings Correlation Chart
The statistical analysis conducted on geographies consisting of 347,936,772 people shows a poor negative correlation between the proportion of Immigrants from Russia and median earnings in the United States with a correlation coefficient (R) of -0.133 and weighted average of $53,457. Similarly, the statistical analysis conducted on geographies consisting of 449,351,529 people shows a weak negative correlation between the proportion of Cubans and median earnings in the United States with a correlation coefficient (R) of -0.287 and weighted average of $40,619, a difference of 31.6%.
Median Earnings Correlation Summary
| Measurement | Immigrants from Russia | Cuban |
| Minimum | $27,990 | $22,371 |
| Maximum | $83,702 | $59,236 |
| Range | $55,712 | $36,865 |
| Mean | $49,525 | $38,708 |
| Median | $50,229 | $38,230 |
| Interquartile 25% (IQ1) | $40,169 | $33,586 |
| Interquartile 75% (IQ3) | $59,535 | $42,663 |
| Interquartile Range (IQR) | $19,366 | $9,077 |
| Standard Deviation (Sample) | $12,722 | $6,670 |
| Standard Deviation (Population) | $12,603 | $6,639 |
Similar Demographics by Median Earnings
Demographics Similar to Immigrants from Russia by Median Earnings
In terms of median earnings, the demographic groups most similar to Immigrants from Russia are Immigrants from France ($53,490, a difference of 0.060%), Cambodian ($53,386, a difference of 0.13%), Russian ($53,334, a difference of 0.23%), Immigrants from Asia ($53,310, a difference of 0.28%), and Immigrants from Greece ($53,282, a difference of 0.33%).
| Demographics | Rating | Rank | Median Earnings |
| Immigrants | Korea | 100.0 /100 | #22 | Exceptional $54,530 |
| Immigrants | Sweden | 100.0 /100 | #23 | Exceptional $54,478 |
| Soviet Union | 100.0 /100 | #24 | Exceptional $54,290 |
| Turks | 100.0 /100 | #25 | Exceptional $53,919 |
| Immigrants | Northern Europe | 100.0 /100 | #26 | Exceptional $53,872 |
| Asians | 100.0 /100 | #27 | Exceptional $53,690 |
| Immigrants | France | 100.0 /100 | #28 | Exceptional $53,490 |
| Immigrants | Russia | 100.0 /100 | #29 | Exceptional $53,457 |
| Cambodians | 100.0 /100 | #30 | Exceptional $53,386 |
| Russians | 100.0 /100 | #31 | Exceptional $53,334 |
| Immigrants | Asia | 100.0 /100 | #32 | Exceptional $53,310 |
| Immigrants | Greece | 100.0 /100 | #33 | Exceptional $53,282 |
| Immigrants | Sri Lanka | 100.0 /100 | #34 | Exceptional $53,268 |
| Immigrants | Switzerland | 100.0 /100 | #35 | Exceptional $53,211 |
| Immigrants | Denmark | 100.0 /100 | #36 | Exceptional $53,186 |
Demographics Similar to Cubans by Median Earnings
In terms of median earnings, the demographic groups most similar to Cubans are Honduran ($40,638, a difference of 0.050%), Yaqui ($40,647, a difference of 0.070%), Chickasaw ($40,672, a difference of 0.13%), Immigrants from Haiti ($40,550, a difference of 0.17%), and Immigrants from Guatemala ($40,851, a difference of 0.57%).
| Demographics | Rating | Rank | Median Earnings |
| Immigrants | Latin America | 0.1 /100 | #301 | Tragic $41,049 |
| Shoshone | 0.0 /100 | #302 | Tragic $40,932 |
| Haitians | 0.0 /100 | #303 | Tragic $40,918 |
| Immigrants | Guatemala | 0.0 /100 | #304 | Tragic $40,851 |
| Chickasaw | 0.0 /100 | #305 | Tragic $40,672 |
| Yaqui | 0.0 /100 | #306 | Tragic $40,647 |
| Hondurans | 0.0 /100 | #307 | Tragic $40,638 |
| Cubans | 0.0 /100 | #308 | Tragic $40,619 |
| Immigrants | Haiti | 0.0 /100 | #309 | Tragic $40,550 |
| Apache | 0.0 /100 | #310 | Tragic $40,388 |
| Hispanics or Latinos | 0.0 /100 | #311 | Tragic $40,288 |
| Chippewa | 0.0 /100 | #312 | Tragic $40,287 |
| Choctaw | 0.0 /100 | #313 | Tragic $40,270 |
| Cheyenne | 0.0 /100 | #314 | Tragic $40,233 |
| Seminole | 0.0 /100 | #315 | Tragic $40,233 |