Israeli vs Cypriot Median Earnings
COMPARE
Israeli
Cypriot
Median Earnings
Median Earnings Comparison
Israelis
Cypriots
$52,937
MEDIAN EARNINGS
100.0/ 100
METRIC RATING
40th/ 347
METRIC RANK
$54,589
MEDIAN EARNINGS
100.0/ 100
METRIC RATING
20th/ 347
METRIC RANK
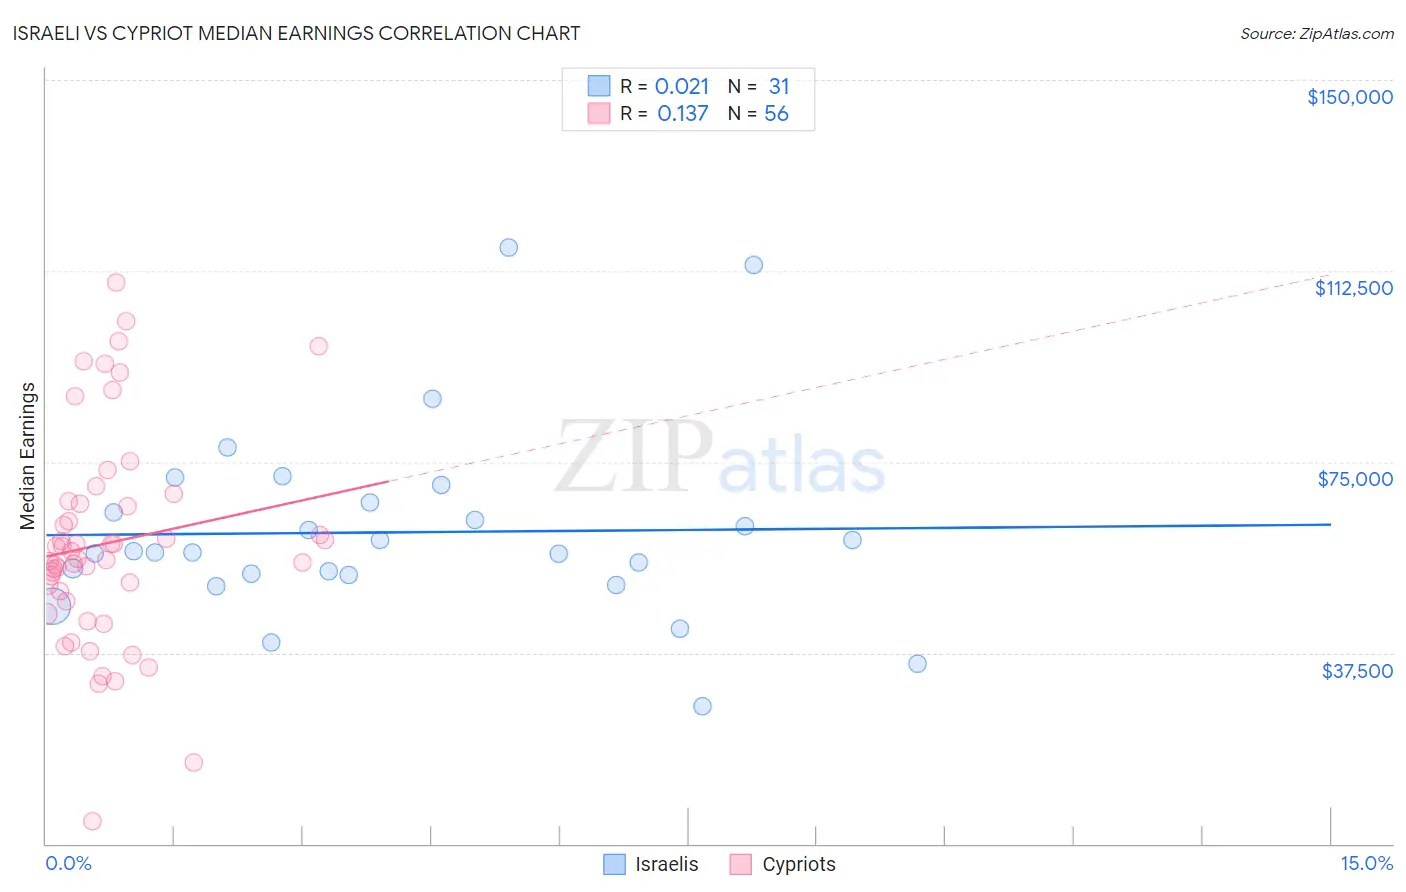
Israeli vs Cypriot Median Earnings Correlation Chart
The statistical analysis conducted on geographies consisting of 211,215,841 people shows no correlation between the proportion of Israelis and median earnings in the United States with a correlation coefficient (R) of 0.021 and weighted average of $52,937. Similarly, the statistical analysis conducted on geographies consisting of 61,853,771 people shows a poor positive correlation between the proportion of Cypriots and median earnings in the United States with a correlation coefficient (R) of 0.137 and weighted average of $54,589, a difference of 3.1%.
Median Earnings Correlation Summary
| Measurement | Israeli | Cypriot |
| Minimum | $27,000 | $4,333 |
| Maximum | $117,019 | $110,295 |
| Range | $90,019 | $105,962 |
| Mean | $61,168 | $59,088 |
| Median | $57,256 | $56,710 |
| Interquartile 25% (IQ1) | $52,851 | $48,668 |
| Interquartile 75% (IQ3) | $67,052 | $66,958 |
| Interquartile Range (IQR) | $14,202 | $18,291 |
| Standard Deviation (Sample) | $18,863 | $21,103 |
| Standard Deviation (Population) | $18,557 | $20,914 |
Demographics Similar to Israelis and Cypriots by Median Earnings
In terms of median earnings, the demographic groups most similar to Israelis are Immigrants from Turkey ($52,960, a difference of 0.040%), Latvian ($53,001, a difference of 0.12%), Immigrants from Belarus ($53,043, a difference of 0.20%), Immigrants from Denmark ($53,186, a difference of 0.47%), and Immigrants from Switzerland ($53,211, a difference of 0.52%). Similarly, the demographic groups most similar to Cypriots are Burmese ($54,559, a difference of 0.060%), Immigrants from Korea ($54,530, a difference of 0.11%), Immigrants from Sweden ($54,478, a difference of 0.20%), Soviet Union ($54,290, a difference of 0.55%), and Turkish ($53,919, a difference of 1.2%).
| Demographics | Rating | Rank | Median Earnings |
| Cypriots | 100.0 /100 | #20 | Exceptional $54,589 |
| Burmese | 100.0 /100 | #21 | Exceptional $54,559 |
| Immigrants | Korea | 100.0 /100 | #22 | Exceptional $54,530 |
| Immigrants | Sweden | 100.0 /100 | #23 | Exceptional $54,478 |
| Soviet Union | 100.0 /100 | #24 | Exceptional $54,290 |
| Turks | 100.0 /100 | #25 | Exceptional $53,919 |
| Immigrants | Northern Europe | 100.0 /100 | #26 | Exceptional $53,872 |
| Asians | 100.0 /100 | #27 | Exceptional $53,690 |
| Immigrants | France | 100.0 /100 | #28 | Exceptional $53,490 |
| Immigrants | Russia | 100.0 /100 | #29 | Exceptional $53,457 |
| Cambodians | 100.0 /100 | #30 | Exceptional $53,386 |
| Russians | 100.0 /100 | #31 | Exceptional $53,334 |
| Immigrants | Asia | 100.0 /100 | #32 | Exceptional $53,310 |
| Immigrants | Greece | 100.0 /100 | #33 | Exceptional $53,282 |
| Immigrants | Sri Lanka | 100.0 /100 | #34 | Exceptional $53,268 |
| Immigrants | Switzerland | 100.0 /100 | #35 | Exceptional $53,211 |
| Immigrants | Denmark | 100.0 /100 | #36 | Exceptional $53,186 |
| Immigrants | Belarus | 100.0 /100 | #37 | Exceptional $53,043 |
| Latvians | 100.0 /100 | #38 | Exceptional $53,001 |
| Immigrants | Turkey | 100.0 /100 | #39 | Exceptional $52,960 |
| Israelis | 100.0 /100 | #40 | Exceptional $52,937 |