Israeli vs Cuban 11th Grade
COMPARE
Israeli
Cuban
11th Grade
11th Grade Comparison
Israelis
Cubans
93.3%
11TH GRADE
97.0/ 100
METRIC RATING
119th/ 347
METRIC RANK
90.2%
11TH GRADE
0.0/ 100
METRIC RATING
292nd/ 347
METRIC RANK
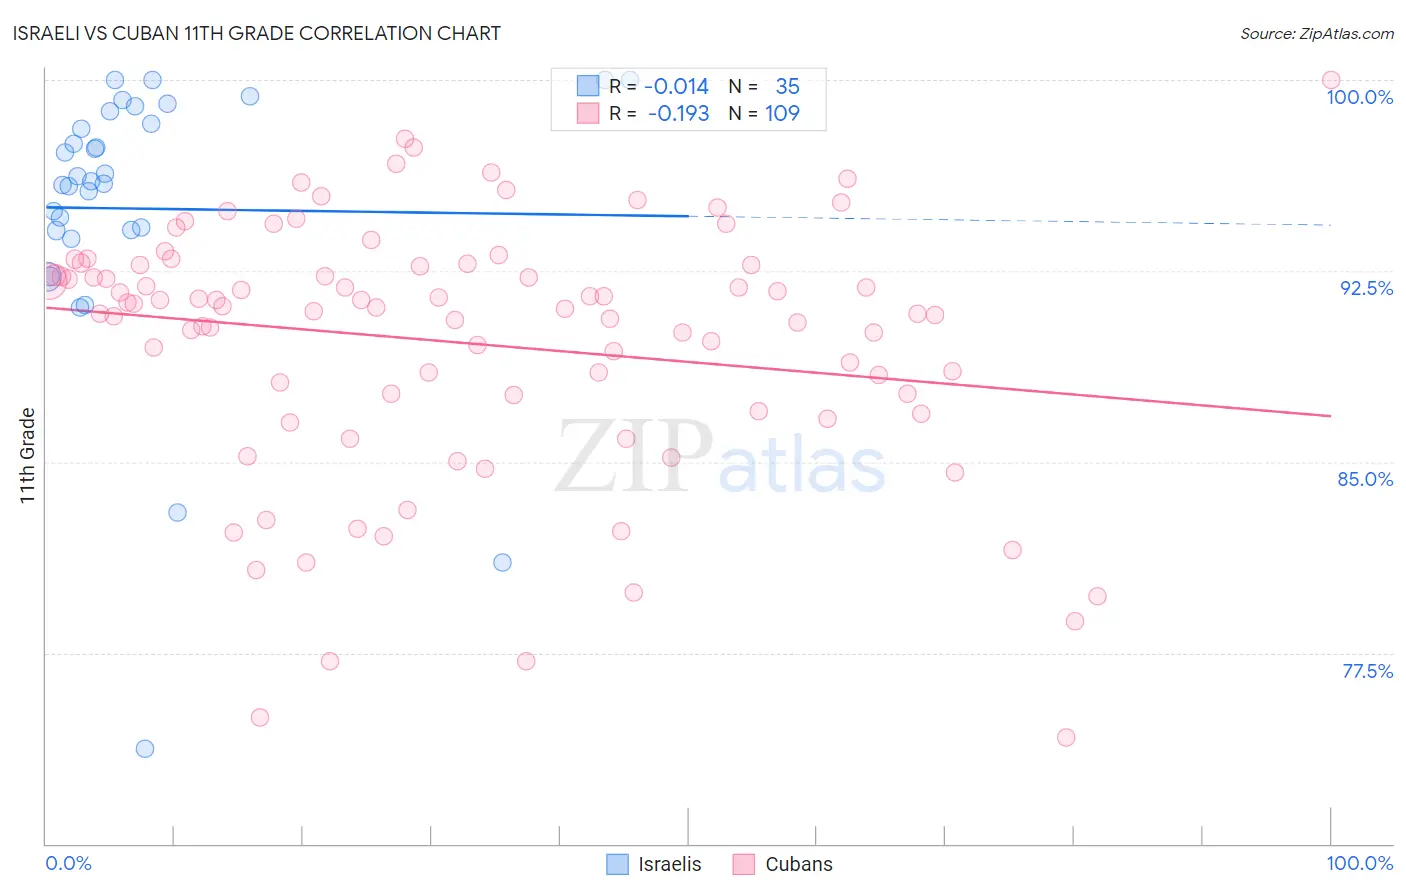
Israeli vs Cuban 11th Grade Correlation Chart
The statistical analysis conducted on geographies consisting of 211,220,151 people shows no correlation between the proportion of Israelis and percentage of population with at least 11th grade education in the United States with a correlation coefficient (R) of -0.014 and weighted average of 93.3%. Similarly, the statistical analysis conducted on geographies consisting of 449,369,652 people shows a poor negative correlation between the proportion of Cubans and percentage of population with at least 11th grade education in the United States with a correlation coefficient (R) of -0.193 and weighted average of 90.2%, a difference of 3.4%.
11th Grade Correlation Summary
| Measurement | Israeli | Cuban |
| Minimum | 73.7% | 74.2% |
| Maximum | 100.0% | 100.0% |
| Range | 26.3% | 25.8% |
| Mean | 94.9% | 89.7% |
| Median | 96.0% | 91.1% |
| Interquartile 25% (IQ1) | 94.1% | 87.3% |
| Interquartile 75% (IQ3) | 98.8% | 92.7% |
| Interquartile Range (IQR) | 4.7% | 5.4% |
| Standard Deviation (Sample) | 5.6% | 5.1% |
| Standard Deviation (Population) | 5.5% | 5.0% |
Similar Demographics by 11th Grade
Demographics Similar to Israelis by 11th Grade
In terms of 11th grade, the demographic groups most similar to Israelis are Immigrants from Korea (93.3%, a difference of 0.0%), Immigrants from Russia (93.3%, a difference of 0.030%), White/Caucasian (93.3%, a difference of 0.040%), Immigrants from Hungary (93.4%, a difference of 0.050%), and German Russian (93.3%, a difference of 0.050%).
| Demographics | Rating | Rank | 11th Grade |
| Immigrants | Germany | 98.0 /100 | #112 | Exceptional 93.4% |
| Immigrants | Zimbabwe | 97.8 /100 | #113 | Exceptional 93.4% |
| Jordanians | 97.8 /100 | #114 | Exceptional 93.4% |
| Palestinians | 97.7 /100 | #115 | Exceptional 93.4% |
| Immigrants | Hungary | 97.5 /100 | #116 | Exceptional 93.4% |
| Whites/Caucasians | 97.4 /100 | #117 | Exceptional 93.3% |
| Immigrants | Korea | 97.0 /100 | #118 | Exceptional 93.3% |
| Israelis | 97.0 /100 | #119 | Exceptional 93.3% |
| Immigrants | Russia | 96.6 /100 | #120 | Exceptional 93.3% |
| German Russians | 96.4 /100 | #121 | Exceptional 93.3% |
| Immigrants | Belarus | 96.3 /100 | #122 | Exceptional 93.3% |
| Immigrants | Greece | 95.9 /100 | #123 | Exceptional 93.2% |
| Immigrants | Eastern Europe | 95.9 /100 | #124 | Exceptional 93.2% |
| Immigrants | Sri Lanka | 95.6 /100 | #125 | Exceptional 93.2% |
| Basques | 95.2 /100 | #126 | Exceptional 93.2% |
Demographics Similar to Cubans by 11th Grade
In terms of 11th grade, the demographic groups most similar to Cubans are Haitian (90.3%, a difference of 0.030%), Indonesian (90.3%, a difference of 0.070%), Native/Alaskan (90.2%, a difference of 0.070%), British West Indian (90.3%, a difference of 0.090%), and Pennsylvania German (90.3%, a difference of 0.11%).
| Demographics | Rating | Rank | 11th Grade |
| Immigrants | Burma/Myanmar | 0.0 /100 | #285 | Tragic 90.4% |
| Immigrants | West Indies | 0.0 /100 | #286 | Tragic 90.4% |
| Apache | 0.0 /100 | #287 | Tragic 90.4% |
| Pennsylvania Germans | 0.0 /100 | #288 | Tragic 90.3% |
| British West Indians | 0.0 /100 | #289 | Tragic 90.3% |
| Indonesians | 0.0 /100 | #290 | Tragic 90.3% |
| Haitians | 0.0 /100 | #291 | Tragic 90.3% |
| Cubans | 0.0 /100 | #292 | Tragic 90.2% |
| Natives/Alaskans | 0.0 /100 | #293 | Tragic 90.2% |
| Immigrants | Grenada | 0.0 /100 | #294 | Tragic 90.1% |
| Immigrants | Vietnam | 0.0 /100 | #295 | Tragic 90.0% |
| Fijians | 0.0 /100 | #296 | Tragic 90.0% |
| Navajo | 0.0 /100 | #297 | Tragic 90.0% |
| Immigrants | Fiji | 0.0 /100 | #298 | Tragic 89.9% |
| Japanese | 0.0 /100 | #299 | Tragic 89.9% |