Israeli vs Cuban Divorced or Separated
COMPARE
Israeli
Cuban
Divorced or Separated
Divorced or Separated Comparison
Israelis
Cubans
11.3%
DIVORCED OR SEPARATED
99.9/ 100
METRIC RATING
59th/ 347
METRIC RANK
14.5%
DIVORCED OR SEPARATED
0.0/ 100
METRIC RATING
344th/ 347
METRIC RANK
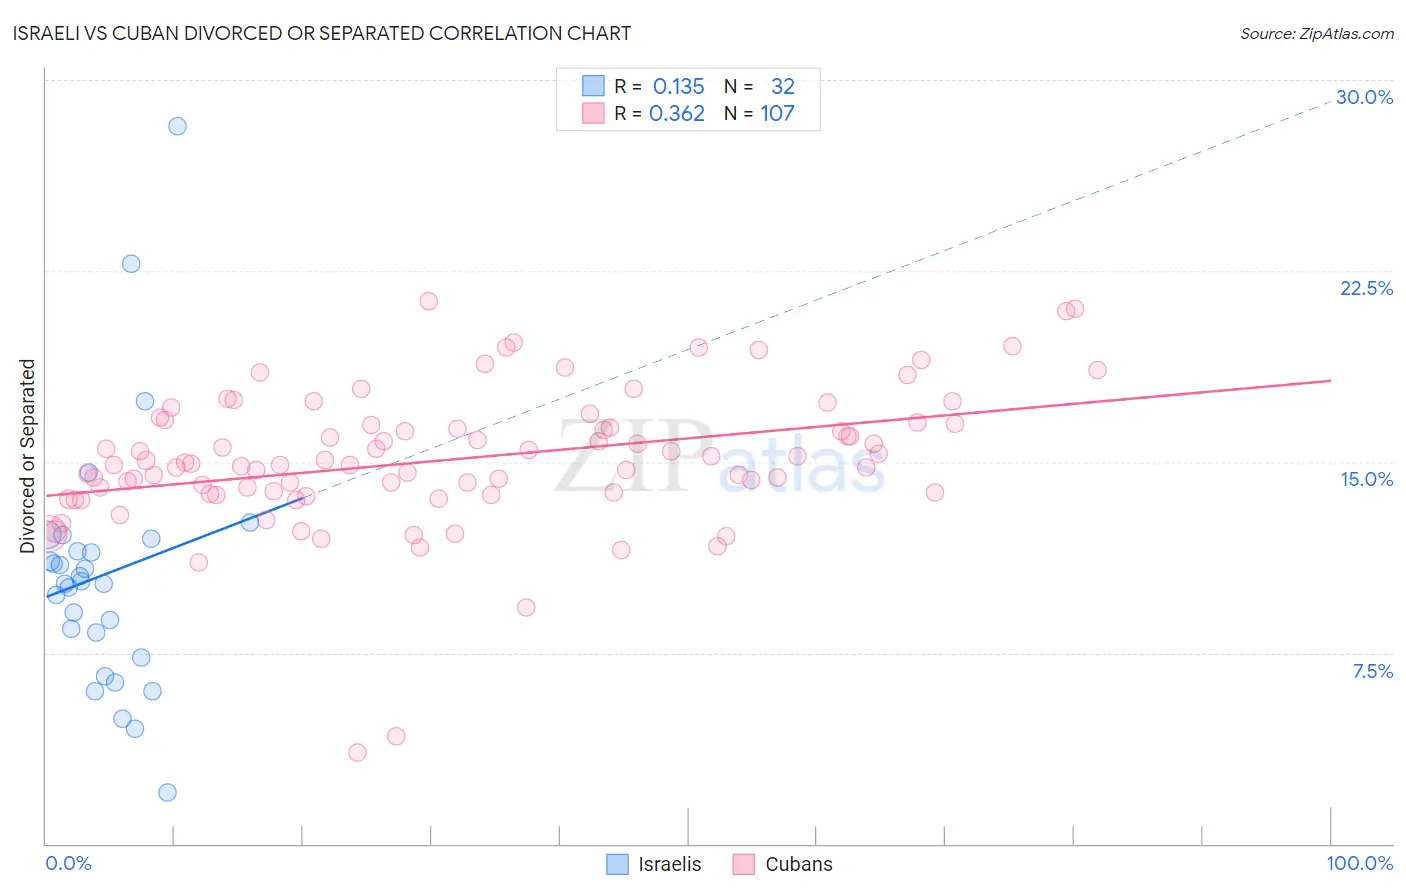
Israeli vs Cuban Divorced or Separated Correlation Chart
The statistical analysis conducted on geographies consisting of 211,065,028 people shows a poor positive correlation between the proportion of Israelis and percentage of population currently divorced or separated in the United States with a correlation coefficient (R) of 0.135 and weighted average of 11.3%. Similarly, the statistical analysis conducted on geographies consisting of 449,144,755 people shows a mild positive correlation between the proportion of Cubans and percentage of population currently divorced or separated in the United States with a correlation coefficient (R) of 0.362 and weighted average of 14.5%, a difference of 28.0%.
Divorced or Separated Correlation Summary
| Measurement | Israeli | Cuban |
| Minimum | 2.0% | 3.6% |
| Maximum | 28.2% | 21.3% |
| Range | 26.2% | 17.7% |
| Mean | 10.6% | 15.1% |
| Median | 10.3% | 14.9% |
| Interquartile 25% (IQ1) | 7.8% | 13.8% |
| Interquartile 75% (IQ3) | 11.8% | 16.5% |
| Interquartile Range (IQR) | 3.9% | 2.7% |
| Standard Deviation (Sample) | 5.0% | 2.8% |
| Standard Deviation (Population) | 4.9% | 2.7% |
Similar Demographics by Divorced or Separated
Demographics Similar to Israelis by Divorced or Separated
In terms of divorced or separated, the demographic groups most similar to Israelis are Sri Lankan (11.3%, a difference of 0.10%), Immigrants from Vietnam (11.3%, a difference of 0.16%), Immigrants from Russia (11.3%, a difference of 0.16%), Immigrants from Philippines (11.3%, a difference of 0.17%), and Korean (11.3%, a difference of 0.17%).
| Demographics | Rating | Rank | Divorced or Separated |
| Immigrants | Australia | 99.9 /100 | #52 | Exceptional 11.3% |
| Immigrants | Lithuania | 99.9 /100 | #53 | Exceptional 11.3% |
| Eastern Europeans | 99.9 /100 | #54 | Exceptional 11.3% |
| Immigrants | Yemen | 99.9 /100 | #55 | Exceptional 11.3% |
| Immigrants | Philippines | 99.9 /100 | #56 | Exceptional 11.3% |
| Immigrants | Vietnam | 99.9 /100 | #57 | Exceptional 11.3% |
| Sri Lankans | 99.9 /100 | #58 | Exceptional 11.3% |
| Israelis | 99.9 /100 | #59 | Exceptional 11.3% |
| Immigrants | Russia | 99.9 /100 | #60 | Exceptional 11.3% |
| Koreans | 99.9 /100 | #61 | Exceptional 11.3% |
| Luxembourgers | 99.9 /100 | #62 | Exceptional 11.3% |
| Immigrants | Kuwait | 99.9 /100 | #63 | Exceptional 11.3% |
| Macedonians | 99.8 /100 | #64 | Exceptional 11.4% |
| Immigrants | South Eastern Asia | 99.8 /100 | #65 | Exceptional 11.4% |
| Inupiat | 99.8 /100 | #66 | Exceptional 11.4% |
Demographics Similar to Cubans by Divorced or Separated
In terms of divorced or separated, the demographic groups most similar to Cubans are Kiowa (14.5%, a difference of 0.10%), Creek (14.4%, a difference of 0.68%), Seminole (14.3%, a difference of 1.7%), Bahamian (14.2%, a difference of 1.9%), and Chickasaw (14.2%, a difference of 2.1%).
| Demographics | Rating | Rank | Divorced or Separated |
| Puerto Ricans | 0.0 /100 | #333 | Tragic 13.9% |
| Immigrants | Bahamas | 0.0 /100 | #334 | Tragic 13.9% |
| Dutch West Indians | 0.0 /100 | #335 | Tragic 14.0% |
| Shoshone | 0.0 /100 | #336 | Tragic 14.0% |
| Crow | 0.0 /100 | #337 | Tragic 14.1% |
| Choctaw | 0.0 /100 | #338 | Tragic 14.1% |
| Colville | 0.0 /100 | #339 | Tragic 14.2% |
| Chickasaw | 0.0 /100 | #340 | Tragic 14.2% |
| Bahamians | 0.0 /100 | #341 | Tragic 14.2% |
| Seminole | 0.0 /100 | #342 | Tragic 14.3% |
| Creek | 0.0 /100 | #343 | Tragic 14.4% |
| Cubans | 0.0 /100 | #344 | Tragic 14.5% |
| Kiowa | 0.0 /100 | #345 | Tragic 14.5% |
| Arapaho | 0.0 /100 | #346 | Tragic 14.8% |
| Immigrants | Cuba | 0.0 /100 | #347 | Tragic 15.2% |