Israeli vs Native Hawaiian Median Earnings
COMPARE
Israeli
Native Hawaiian
Median Earnings
Median Earnings Comparison
Israelis
Native Hawaiians
$52,937
MEDIAN EARNINGS
100.0/ 100
METRIC RATING
40th/ 347
METRIC RANK
$45,027
MEDIAN EARNINGS
12.2/ 100
METRIC RATING
227th/ 347
METRIC RANK
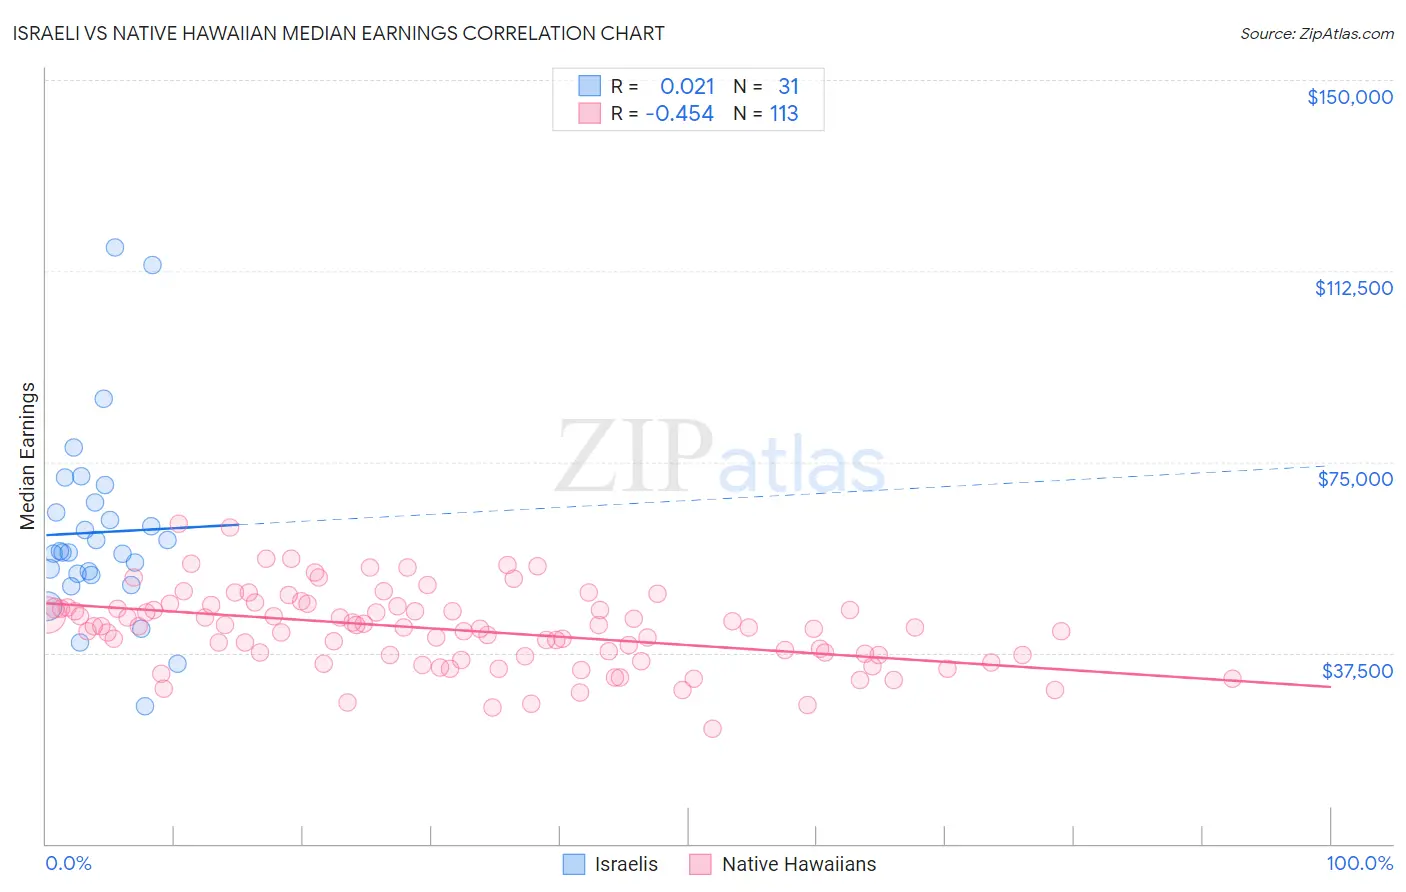
Israeli vs Native Hawaiian Median Earnings Correlation Chart
The statistical analysis conducted on geographies consisting of 211,215,841 people shows no correlation between the proportion of Israelis and median earnings in the United States with a correlation coefficient (R) of 0.021 and weighted average of $52,937. Similarly, the statistical analysis conducted on geographies consisting of 332,103,903 people shows a moderate negative correlation between the proportion of Native Hawaiians and median earnings in the United States with a correlation coefficient (R) of -0.454 and weighted average of $45,027, a difference of 17.6%.
Median Earnings Correlation Summary
| Measurement | Israeli | Native Hawaiian |
| Minimum | $27,000 | $22,468 |
| Maximum | $117,019 | $62,910 |
| Range | $90,019 | $40,442 |
| Mean | $61,168 | $42,021 |
| Median | $57,256 | $42,485 |
| Interquartile 25% (IQ1) | $52,851 | $36,941 |
| Interquartile 75% (IQ3) | $67,052 | $46,349 |
| Interquartile Range (IQR) | $14,202 | $9,407 |
| Standard Deviation (Sample) | $18,863 | $7,647 |
| Standard Deviation (Population) | $18,557 | $7,613 |
Similar Demographics by Median Earnings
Demographics Similar to Israelis by Median Earnings
In terms of median earnings, the demographic groups most similar to Israelis are Immigrants from Turkey ($52,960, a difference of 0.040%), Latvian ($53,001, a difference of 0.12%), Immigrants from Belarus ($53,043, a difference of 0.20%), Immigrants from Lithuania ($52,769, a difference of 0.32%), and Immigrants from Denmark ($53,186, a difference of 0.47%).
| Demographics | Rating | Rank | Median Earnings |
| Immigrants | Greece | 100.0 /100 | #33 | Exceptional $53,282 |
| Immigrants | Sri Lanka | 100.0 /100 | #34 | Exceptional $53,268 |
| Immigrants | Switzerland | 100.0 /100 | #35 | Exceptional $53,211 |
| Immigrants | Denmark | 100.0 /100 | #36 | Exceptional $53,186 |
| Immigrants | Belarus | 100.0 /100 | #37 | Exceptional $53,043 |
| Latvians | 100.0 /100 | #38 | Exceptional $53,001 |
| Immigrants | Turkey | 100.0 /100 | #39 | Exceptional $52,960 |
| Israelis | 100.0 /100 | #40 | Exceptional $52,937 |
| Immigrants | Lithuania | 100.0 /100 | #41 | Exceptional $52,769 |
| Maltese | 100.0 /100 | #42 | Exceptional $52,526 |
| Immigrants | Malaysia | 100.0 /100 | #43 | Exceptional $52,514 |
| Bulgarians | 100.0 /100 | #44 | Exceptional $52,512 |
| Immigrants | Czechoslovakia | 100.0 /100 | #45 | Exceptional $52,361 |
| Bhutanese | 100.0 /100 | #46 | Exceptional $52,297 |
| Australians | 100.0 /100 | #47 | Exceptional $52,294 |
Demographics Similar to Native Hawaiians by Median Earnings
In terms of median earnings, the demographic groups most similar to Native Hawaiians are Immigrants from Nigeria ($45,030, a difference of 0.010%), Immigrants from Iraq ($44,988, a difference of 0.090%), Immigrants from Cambodia ($45,090, a difference of 0.14%), West Indian ($45,132, a difference of 0.23%), and Scotch-Irish ($44,924, a difference of 0.23%).
| Demographics | Rating | Rank | Median Earnings |
| Ecuadorians | 15.3 /100 | #220 | Poor $45,214 |
| Immigrants | Guyana | 15.1 /100 | #221 | Poor $45,204 |
| Immigrants | Panama | 15.0 /100 | #222 | Poor $45,198 |
| Whites/Caucasians | 15.0 /100 | #223 | Poor $45,197 |
| West Indians | 13.9 /100 | #224 | Poor $45,132 |
| Immigrants | Cambodia | 13.2 /100 | #225 | Poor $45,090 |
| Immigrants | Nigeria | 12.2 /100 | #226 | Poor $45,030 |
| Native Hawaiians | 12.2 /100 | #227 | Poor $45,027 |
| Immigrants | Iraq | 11.6 /100 | #228 | Poor $44,988 |
| Scotch-Irish | 10.7 /100 | #229 | Poor $44,924 |
| Immigrants | Western Africa | 10.3 /100 | #230 | Poor $44,893 |
| Japanese | 9.5 /100 | #231 | Tragic $44,825 |
| Delaware | 9.0 /100 | #232 | Tragic $44,783 |
| Immigrants | Sudan | 8.8 /100 | #233 | Tragic $44,767 |
| Cape Verdeans | 7.5 /100 | #234 | Tragic $44,640 |