Guatemalan vs Spanish American Indian Median Family Income
COMPARE
Guatemalan
Spanish American Indian
Median Family Income
Median Family Income Comparison
Guatemalans
Spanish American Indians
$88,295
MEDIAN FAMILY INCOME
0.1/ 100
METRIC RATING
285th/ 347
METRIC RANK
$85,728
MEDIAN FAMILY INCOME
0.0/ 100
METRIC RATING
302nd/ 347
METRIC RANK
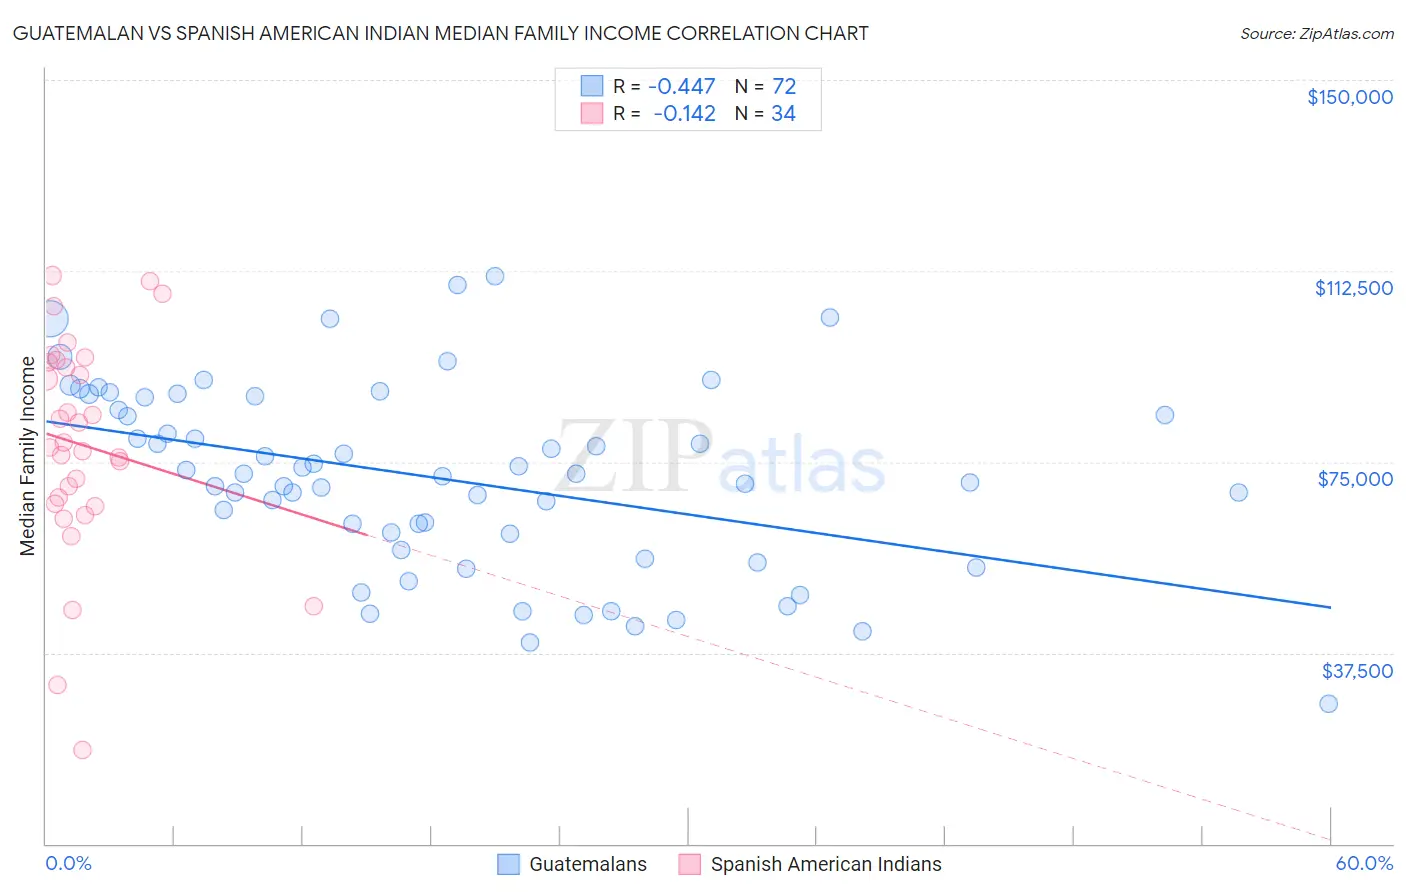
Guatemalan vs Spanish American Indian Median Family Income Correlation Chart
The statistical analysis conducted on geographies consisting of 409,160,818 people shows a moderate negative correlation between the proportion of Guatemalans and median family income in the United States with a correlation coefficient (R) of -0.447 and weighted average of $88,295. Similarly, the statistical analysis conducted on geographies consisting of 73,144,470 people shows a poor negative correlation between the proportion of Spanish American Indians and median family income in the United States with a correlation coefficient (R) of -0.142 and weighted average of $85,728, a difference of 3.0%.
Median Family Income Correlation Summary
| Measurement | Guatemalan | Spanish American Indian |
| Minimum | $27,406 | $18,487 |
| Maximum | $111,362 | $111,586 |
| Range | $83,956 | $93,099 |
| Mean | $71,713 | $78,286 |
| Median | $72,451 | $78,276 |
| Interquartile 25% (IQ1) | $59,369 | $66,839 |
| Interquartile 75% (IQ3) | $86,431 | $94,568 |
| Interquartile Range (IQR) | $27,062 | $27,730 |
| Standard Deviation (Sample) | $18,247 | $21,408 |
| Standard Deviation (Population) | $18,120 | $21,091 |
Demographics Similar to Guatemalans and Spanish American Indians by Median Family Income
In terms of median family income, the demographic groups most similar to Guatemalans are Indonesian ($88,301, a difference of 0.010%), Immigrants from Nicaragua ($88,267, a difference of 0.030%), Potawatomi ($88,265, a difference of 0.030%), Bangladeshi ($88,358, a difference of 0.070%), and Cherokee ($88,209, a difference of 0.10%). Similarly, the demographic groups most similar to Spanish American Indians are Colville ($85,792, a difference of 0.070%), Hispanic or Latino ($85,647, a difference of 0.090%), Ottawa ($86,380, a difference of 0.76%), Chippewa ($86,852, a difference of 1.3%), and Immigrants from Latin America ($86,989, a difference of 1.5%).
| Demographics | Rating | Rank | Median Family Income |
| Bangladeshis | 0.1 /100 | #283 | Tragic $88,358 |
| Indonesians | 0.1 /100 | #284 | Tragic $88,301 |
| Guatemalans | 0.1 /100 | #285 | Tragic $88,295 |
| Immigrants | Nicaragua | 0.1 /100 | #286 | Tragic $88,267 |
| Potawatomi | 0.1 /100 | #287 | Tragic $88,265 |
| Cherokee | 0.1 /100 | #288 | Tragic $88,209 |
| Central American Indians | 0.1 /100 | #289 | Tragic $88,034 |
| Shoshone | 0.1 /100 | #290 | Tragic $87,872 |
| Immigrants | Cabo Verde | 0.1 /100 | #291 | Tragic $87,830 |
| Africans | 0.1 /100 | #292 | Tragic $87,820 |
| Ute | 0.0 /100 | #293 | Tragic $87,596 |
| Fijians | 0.0 /100 | #294 | Tragic $87,387 |
| Yaqui | 0.0 /100 | #295 | Tragic $87,289 |
| Immigrants | Guatemala | 0.0 /100 | #296 | Tragic $87,191 |
| Cajuns | 0.0 /100 | #297 | Tragic $87,157 |
| Immigrants | Latin America | 0.0 /100 | #298 | Tragic $86,989 |
| Chippewa | 0.0 /100 | #299 | Tragic $86,852 |
| Ottawa | 0.0 /100 | #300 | Tragic $86,380 |
| Colville | 0.0 /100 | #301 | Tragic $85,792 |
| Spanish American Indians | 0.0 /100 | #302 | Tragic $85,728 |
| Hispanics or Latinos | 0.0 /100 | #303 | Tragic $85,647 |