Colville vs Spanish American Indian Median Family Income
COMPARE
Colville
Spanish American Indian
Median Family Income
Median Family Income Comparison
Colville
Spanish American Indians
$85,792
MEDIAN FAMILY INCOME
0.0/ 100
METRIC RATING
301st/ 347
METRIC RANK
$85,728
MEDIAN FAMILY INCOME
0.0/ 100
METRIC RATING
302nd/ 347
METRIC RANK
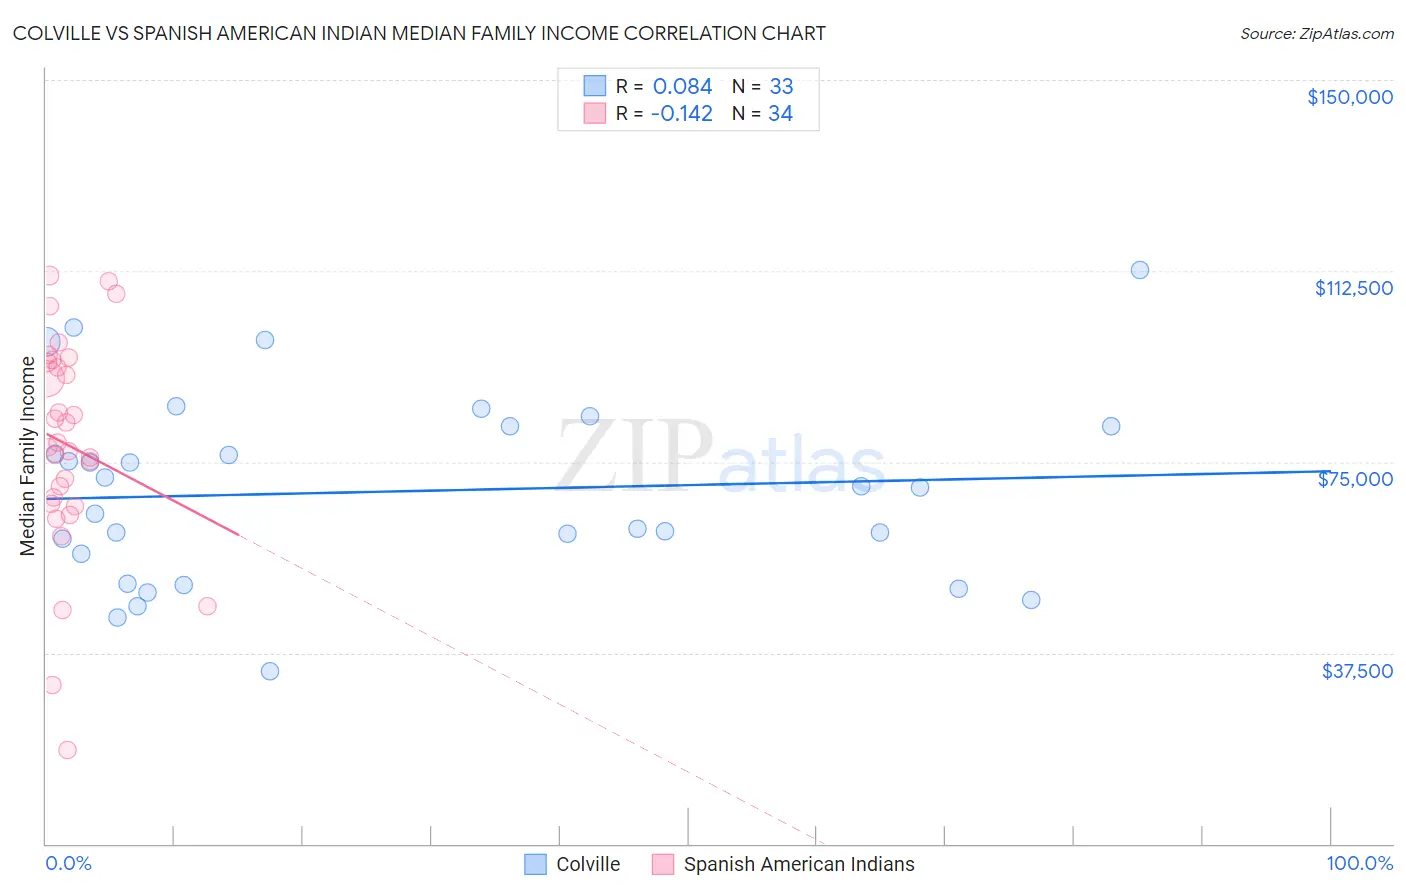
Colville vs Spanish American Indian Median Family Income Correlation Chart
The statistical analysis conducted on geographies consisting of 34,680,416 people shows a slight positive correlation between the proportion of Colville and median family income in the United States with a correlation coefficient (R) of 0.084 and weighted average of $85,792. Similarly, the statistical analysis conducted on geographies consisting of 73,144,470 people shows a poor negative correlation between the proportion of Spanish American Indians and median family income in the United States with a correlation coefficient (R) of -0.142 and weighted average of $85,728, a difference of 0.070%.
Median Family Income Correlation Summary
| Measurement | Colville | Spanish American Indian |
| Minimum | $33,824 | $18,487 |
| Maximum | $112,639 | $111,586 |
| Range | $78,815 | $93,099 |
| Mean | $69,185 | $78,286 |
| Median | $70,000 | $78,276 |
| Interquartile 25% (IQ1) | $53,997 | $66,839 |
| Interquartile 75% (IQ3) | $82,061 | $94,568 |
| Interquartile Range (IQR) | $28,064 | $27,730 |
| Standard Deviation (Sample) | $18,382 | $21,408 |
| Standard Deviation (Population) | $18,102 | $21,091 |
Demographics Similar to Colville and Spanish American Indians by Median Family Income
In terms of median family income, the demographic groups most similar to Colville are Hispanic or Latino ($85,647, a difference of 0.17%), Mexican ($85,618, a difference of 0.20%), Paiute ($85,414, a difference of 0.44%), Immigrants from Dominica ($85,411, a difference of 0.45%), and Chickasaw ($85,356, a difference of 0.51%). Similarly, the demographic groups most similar to Spanish American Indians are Hispanic or Latino ($85,647, a difference of 0.090%), Mexican ($85,618, a difference of 0.13%), Paiute ($85,414, a difference of 0.37%), Immigrants from Dominica ($85,411, a difference of 0.37%), and Chickasaw ($85,356, a difference of 0.44%).
| Demographics | Rating | Rank | Median Family Income |
| Immigrants | Cabo Verde | 0.1 /100 | #291 | Tragic $87,830 |
| Africans | 0.1 /100 | #292 | Tragic $87,820 |
| Ute | 0.0 /100 | #293 | Tragic $87,596 |
| Fijians | 0.0 /100 | #294 | Tragic $87,387 |
| Yaqui | 0.0 /100 | #295 | Tragic $87,289 |
| Immigrants | Guatemala | 0.0 /100 | #296 | Tragic $87,191 |
| Cajuns | 0.0 /100 | #297 | Tragic $87,157 |
| Immigrants | Latin America | 0.0 /100 | #298 | Tragic $86,989 |
| Chippewa | 0.0 /100 | #299 | Tragic $86,852 |
| Ottawa | 0.0 /100 | #300 | Tragic $86,380 |
| Colville | 0.0 /100 | #301 | Tragic $85,792 |
| Spanish American Indians | 0.0 /100 | #302 | Tragic $85,728 |
| Hispanics or Latinos | 0.0 /100 | #303 | Tragic $85,647 |
| Mexicans | 0.0 /100 | #304 | Tragic $85,618 |
| Paiute | 0.0 /100 | #305 | Tragic $85,414 |
| Immigrants | Dominica | 0.0 /100 | #306 | Tragic $85,411 |
| Chickasaw | 0.0 /100 | #307 | Tragic $85,356 |
| U.S. Virgin Islanders | 0.0 /100 | #308 | Tragic $85,294 |
| Haitians | 0.0 /100 | #309 | Tragic $85,218 |
| Immigrants | Central America | 0.0 /100 | #310 | Tragic $85,050 |
| Hondurans | 0.0 /100 | #311 | Tragic $85,004 |