Dominican vs Spanish American Indian Median Family Income
COMPARE
Dominican
Spanish American Indian
Median Family Income
Median Family Income Comparison
Dominicans
Spanish American Indians
$82,888
MEDIAN FAMILY INCOME
0.0/ 100
METRIC RATING
322nd/ 347
METRIC RANK
$85,728
MEDIAN FAMILY INCOME
0.0/ 100
METRIC RATING
302nd/ 347
METRIC RANK
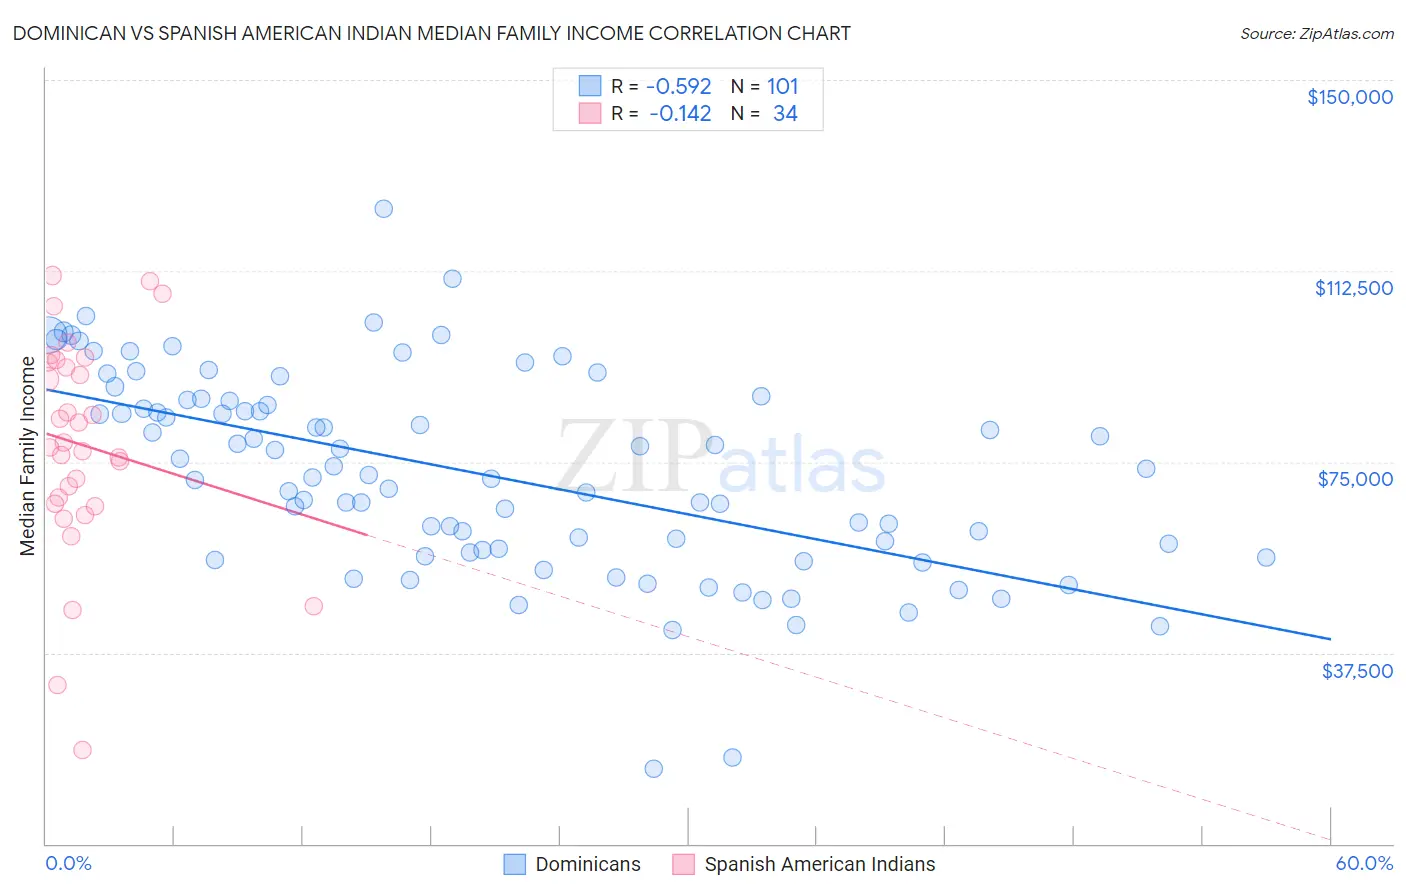
Dominican vs Spanish American Indian Median Family Income Correlation Chart
The statistical analysis conducted on geographies consisting of 354,580,571 people shows a substantial negative correlation between the proportion of Dominicans and median family income in the United States with a correlation coefficient (R) of -0.592 and weighted average of $82,888. Similarly, the statistical analysis conducted on geographies consisting of 73,144,470 people shows a poor negative correlation between the proportion of Spanish American Indians and median family income in the United States with a correlation coefficient (R) of -0.142 and weighted average of $85,728, a difference of 3.4%.
Median Family Income Correlation Summary
| Measurement | Dominican | Spanish American Indian |
| Minimum | $14,766 | $18,487 |
| Maximum | $124,734 | $111,586 |
| Range | $109,968 | $93,099 |
| Mean | $72,735 | $78,286 |
| Median | $72,364 | $78,276 |
| Interquartile 25% (IQ1) | $57,406 | $66,839 |
| Interquartile 75% (IQ3) | $87,079 | $94,568 |
| Interquartile Range (IQR) | $29,673 | $27,730 |
| Standard Deviation (Sample) | $19,775 | $21,408 |
| Standard Deviation (Population) | $19,677 | $21,091 |
Demographics Similar to Dominicans and Spanish American Indians by Median Family Income
In terms of median family income, the demographic groups most similar to Dominicans are Immigrants from Caribbean ($83,319, a difference of 0.52%), Seminole ($83,354, a difference of 0.56%), Immigrants from Honduras ($83,618, a difference of 0.88%), Immigrants from Mexico ($83,639, a difference of 0.91%), and Yakama ($83,932, a difference of 1.3%). Similarly, the demographic groups most similar to Spanish American Indians are Hispanic or Latino ($85,647, a difference of 0.090%), Mexican ($85,618, a difference of 0.13%), Paiute ($85,414, a difference of 0.37%), Immigrants from Dominica ($85,411, a difference of 0.37%), and Chickasaw ($85,356, a difference of 0.44%).
| Demographics | Rating | Rank | Median Family Income |
| Spanish American Indians | 0.0 /100 | #302 | Tragic $85,728 |
| Hispanics or Latinos | 0.0 /100 | #303 | Tragic $85,647 |
| Mexicans | 0.0 /100 | #304 | Tragic $85,618 |
| Paiute | 0.0 /100 | #305 | Tragic $85,414 |
| Immigrants | Dominica | 0.0 /100 | #306 | Tragic $85,411 |
| Chickasaw | 0.0 /100 | #307 | Tragic $85,356 |
| U.S. Virgin Islanders | 0.0 /100 | #308 | Tragic $85,294 |
| Haitians | 0.0 /100 | #309 | Tragic $85,218 |
| Immigrants | Central America | 0.0 /100 | #310 | Tragic $85,050 |
| Hondurans | 0.0 /100 | #311 | Tragic $85,004 |
| Cubans | 0.0 /100 | #312 | Tragic $84,981 |
| Choctaw | 0.0 /100 | #313 | Tragic $84,835 |
| Immigrants | Bahamas | 0.0 /100 | #314 | Tragic $84,732 |
| Apache | 0.0 /100 | #315 | Tragic $84,451 |
| Immigrants | Haiti | 0.0 /100 | #316 | Tragic $84,018 |
| Yakama | 0.0 /100 | #317 | Tragic $83,932 |
| Immigrants | Mexico | 0.0 /100 | #318 | Tragic $83,639 |
| Immigrants | Honduras | 0.0 /100 | #319 | Tragic $83,618 |
| Seminole | 0.0 /100 | #320 | Tragic $83,354 |
| Immigrants | Caribbean | 0.0 /100 | #321 | Tragic $83,319 |
| Dominicans | 0.0 /100 | #322 | Tragic $82,888 |