Iranian vs Soviet Union Median Female Earnings
COMPARE
Iranian
Soviet Union
Median Female Earnings
Median Female Earnings Comparison
Iranians
Soviet Union
$47,421
MEDIAN FEMALE EARNINGS
100.0/ 100
METRIC RATING
8th/ 347
METRIC RANK
$46,556
MEDIAN FEMALE EARNINGS
100.0/ 100
METRIC RATING
14th/ 347
METRIC RANK
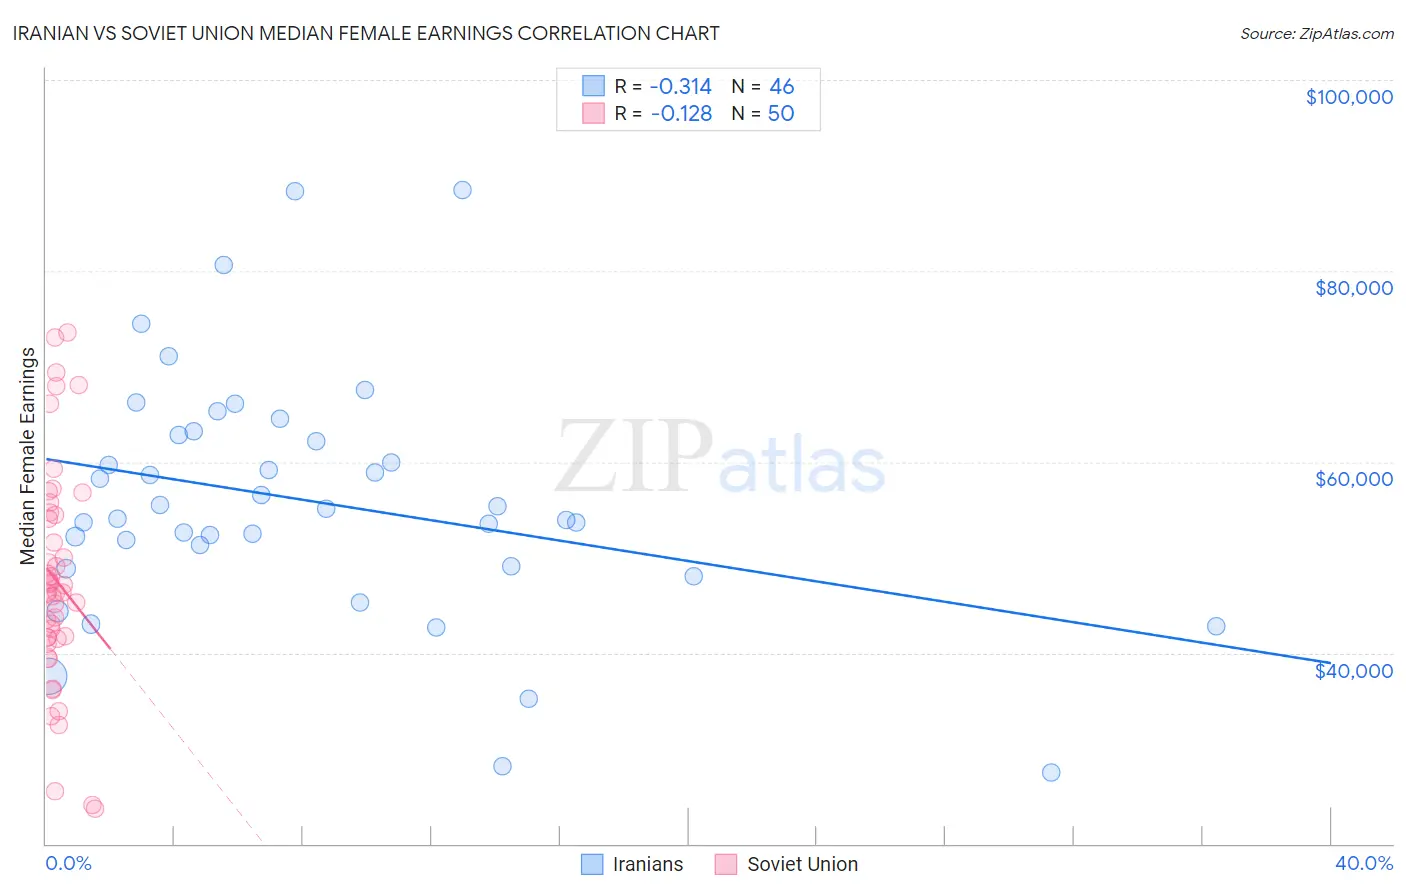
Iranian vs Soviet Union Median Female Earnings Correlation Chart
The statistical analysis conducted on geographies consisting of 316,781,668 people shows a mild negative correlation between the proportion of Iranians and median female earnings in the United States with a correlation coefficient (R) of -0.314 and weighted average of $47,421. Similarly, the statistical analysis conducted on geographies consisting of 43,506,452 people shows a poor negative correlation between the proportion of Soviet Union and median female earnings in the United States with a correlation coefficient (R) of -0.128 and weighted average of $46,556, a difference of 1.9%.
Median Female Earnings Correlation Summary
| Measurement | Iranian | Soviet Union |
| Minimum | $27,465 | $23,611 |
| Maximum | $88,523 | $73,520 |
| Range | $61,058 | $49,909 |
| Mean | $55,900 | $47,577 |
| Median | $54,566 | $46,321 |
| Interquartile 25% (IQ1) | $49,107 | $41,646 |
| Interquartile 75% (IQ3) | $62,773 | $54,381 |
| Interquartile Range (IQR) | $13,666 | $12,735 |
| Standard Deviation (Sample) | $12,815 | $11,528 |
| Standard Deviation (Population) | $12,675 | $11,412 |
Demographics Similar to Iranians and Soviet Union by Median Female Earnings
In terms of median female earnings, the demographic groups most similar to Iranians are Thai ($47,577, a difference of 0.33%), Immigrants from Ireland ($47,598, a difference of 0.37%), Immigrants from Iran ($47,154, a difference of 0.57%), Immigrants from China ($46,972, a difference of 0.95%), and Okinawan ($46,905, a difference of 1.1%). Similarly, the demographic groups most similar to Soviet Union are Immigrants from Australia ($46,573, a difference of 0.040%), Immigrants from Eastern Asia ($46,502, a difference of 0.11%), Indian (Asian) ($46,481, a difference of 0.16%), Immigrants from South Central Asia ($46,324, a difference of 0.50%), and Immigrants from Israel ($46,902, a difference of 0.74%).
| Demographics | Rating | Rank | Median Female Earnings |
| Immigrants | Hong Kong | 100.0 /100 | #1 | Exceptional $49,818 |
| Filipinos | 100.0 /100 | #2 | Exceptional $49,508 |
| Immigrants | Taiwan | 100.0 /100 | #3 | Exceptional $49,256 |
| Immigrants | India | 100.0 /100 | #4 | Exceptional $48,292 |
| Immigrants | Singapore | 100.0 /100 | #5 | Exceptional $47,986 |
| Immigrants | Ireland | 100.0 /100 | #6 | Exceptional $47,598 |
| Thais | 100.0 /100 | #7 | Exceptional $47,577 |
| Iranians | 100.0 /100 | #8 | Exceptional $47,421 |
| Immigrants | Iran | 100.0 /100 | #9 | Exceptional $47,154 |
| Immigrants | China | 100.0 /100 | #10 | Exceptional $46,972 |
| Okinawans | 100.0 /100 | #11 | Exceptional $46,905 |
| Immigrants | Israel | 100.0 /100 | #12 | Exceptional $46,902 |
| Immigrants | Australia | 100.0 /100 | #13 | Exceptional $46,573 |
| Soviet Union | 100.0 /100 | #14 | Exceptional $46,556 |
| Immigrants | Eastern Asia | 100.0 /100 | #15 | Exceptional $46,502 |
| Indians (Asian) | 100.0 /100 | #16 | Exceptional $46,481 |
| Immigrants | South Central Asia | 100.0 /100 | #17 | Exceptional $46,324 |
| Cypriots | 100.0 /100 | #18 | Exceptional $45,570 |
| Eastern Europeans | 100.0 /100 | #19 | Exceptional $45,385 |
| Immigrants | Japan | 100.0 /100 | #20 | Exceptional $45,323 |
| Cambodians | 100.0 /100 | #21 | Exceptional $45,014 |