Iranian vs French American Indian Median Female Earnings
COMPARE
Iranian
French American Indian
Median Female Earnings
Median Female Earnings Comparison
Iranians
French American Indians
$47,421
MEDIAN FEMALE EARNINGS
100.0/ 100
METRIC RATING
8th/ 347
METRIC RANK
$36,920
MEDIAN FEMALE EARNINGS
0.3/ 100
METRIC RATING
270th/ 347
METRIC RANK
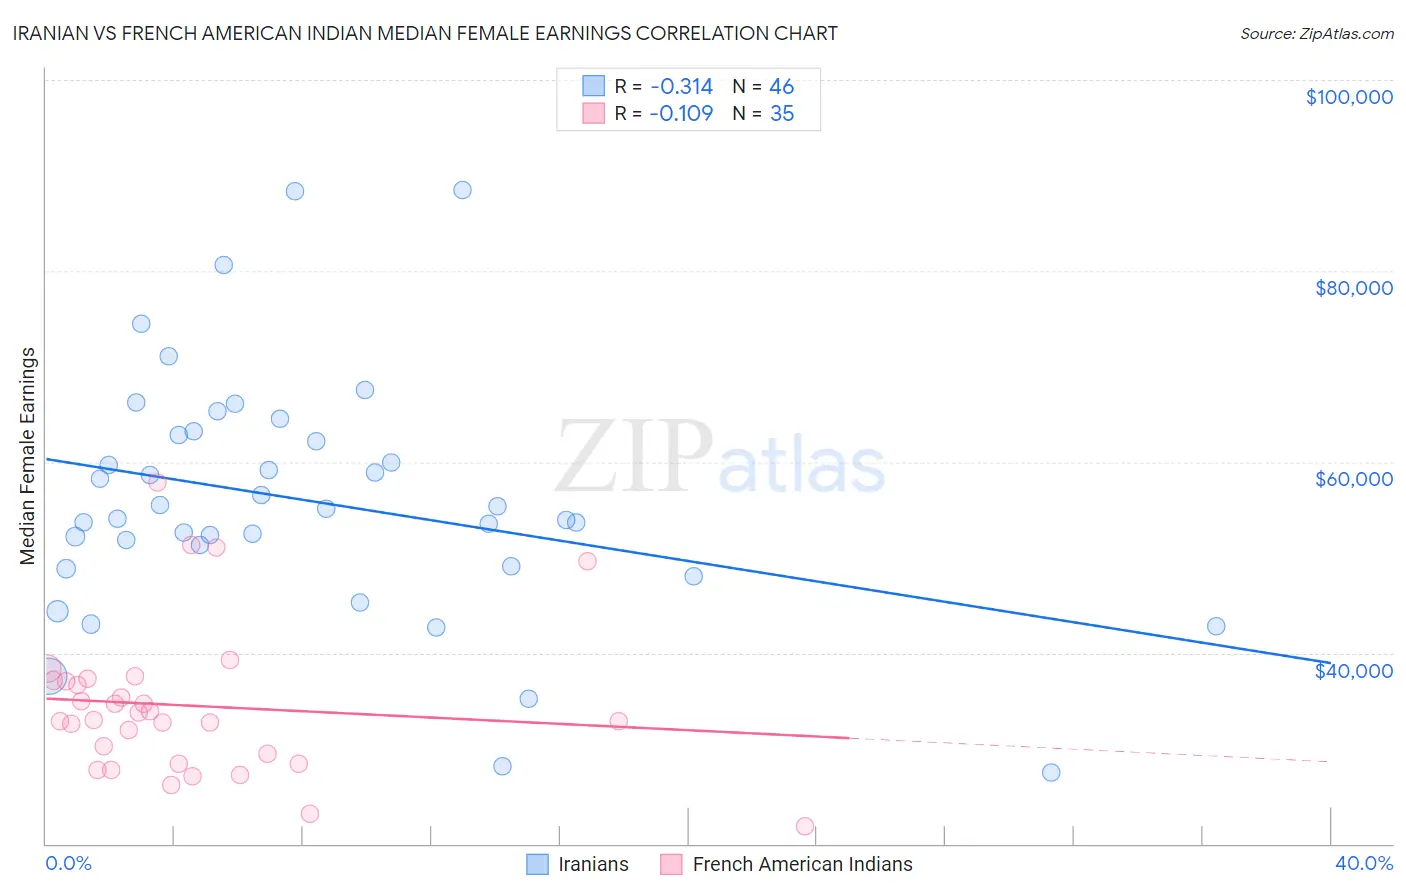
Iranian vs French American Indian Median Female Earnings Correlation Chart
The statistical analysis conducted on geographies consisting of 316,781,668 people shows a mild negative correlation between the proportion of Iranians and median female earnings in the United States with a correlation coefficient (R) of -0.314 and weighted average of $47,421. Similarly, the statistical analysis conducted on geographies consisting of 131,945,906 people shows a poor negative correlation between the proportion of French American Indians and median female earnings in the United States with a correlation coefficient (R) of -0.109 and weighted average of $36,920, a difference of 28.4%.
Median Female Earnings Correlation Summary
| Measurement | Iranian | French American Indian |
| Minimum | $27,465 | $21,875 |
| Maximum | $88,523 | $57,813 |
| Range | $61,058 | $35,938 |
| Mean | $55,900 | $34,449 |
| Median | $54,566 | $32,961 |
| Interquartile 25% (IQ1) | $49,107 | $28,438 |
| Interquartile 75% (IQ3) | $62,773 | $37,095 |
| Interquartile Range (IQR) | $13,666 | $8,657 |
| Standard Deviation (Sample) | $12,815 | $7,858 |
| Standard Deviation (Population) | $12,675 | $7,745 |
Similar Demographics by Median Female Earnings
Demographics Similar to Iranians by Median Female Earnings
In terms of median female earnings, the demographic groups most similar to Iranians are Thai ($47,577, a difference of 0.33%), Immigrants from Ireland ($47,598, a difference of 0.37%), Immigrants from Iran ($47,154, a difference of 0.57%), Immigrants from China ($46,972, a difference of 0.95%), and Okinawan ($46,905, a difference of 1.1%).
| Demographics | Rating | Rank | Median Female Earnings |
| Immigrants | Hong Kong | 100.0 /100 | #1 | Exceptional $49,818 |
| Filipinos | 100.0 /100 | #2 | Exceptional $49,508 |
| Immigrants | Taiwan | 100.0 /100 | #3 | Exceptional $49,256 |
| Immigrants | India | 100.0 /100 | #4 | Exceptional $48,292 |
| Immigrants | Singapore | 100.0 /100 | #5 | Exceptional $47,986 |
| Immigrants | Ireland | 100.0 /100 | #6 | Exceptional $47,598 |
| Thais | 100.0 /100 | #7 | Exceptional $47,577 |
| Iranians | 100.0 /100 | #8 | Exceptional $47,421 |
| Immigrants | Iran | 100.0 /100 | #9 | Exceptional $47,154 |
| Immigrants | China | 100.0 /100 | #10 | Exceptional $46,972 |
| Okinawans | 100.0 /100 | #11 | Exceptional $46,905 |
| Immigrants | Israel | 100.0 /100 | #12 | Exceptional $46,902 |
| Immigrants | Australia | 100.0 /100 | #13 | Exceptional $46,573 |
| Soviet Union | 100.0 /100 | #14 | Exceptional $46,556 |
| Immigrants | Eastern Asia | 100.0 /100 | #15 | Exceptional $46,502 |
Demographics Similar to French American Indians by Median Female Earnings
In terms of median female earnings, the demographic groups most similar to French American Indians are Nicaraguan ($36,904, a difference of 0.040%), Immigrants from Dominican Republic ($36,857, a difference of 0.17%), Immigrants from Laos ($36,841, a difference of 0.21%), Immigrants from Venezuela ($37,003, a difference of 0.23%), and Cree ($37,018, a difference of 0.27%).
| Demographics | Rating | Rank | Median Female Earnings |
| German Russians | 0.5 /100 | #263 | Tragic $37,105 |
| Salvadorans | 0.4 /100 | #264 | Tragic $37,083 |
| Immigrants | Belize | 0.4 /100 | #265 | Tragic $37,056 |
| Dominicans | 0.4 /100 | #266 | Tragic $37,046 |
| Immigrants | Nonimmigrants | 0.4 /100 | #267 | Tragic $37,024 |
| Cree | 0.4 /100 | #268 | Tragic $37,018 |
| Immigrants | Venezuela | 0.4 /100 | #269 | Tragic $37,003 |
| French American Indians | 0.3 /100 | #270 | Tragic $36,920 |
| Nicaraguans | 0.3 /100 | #271 | Tragic $36,904 |
| Immigrants | Dominican Republic | 0.3 /100 | #272 | Tragic $36,857 |
| Immigrants | Laos | 0.3 /100 | #273 | Tragic $36,841 |
| Immigrants | El Salvador | 0.2 /100 | #274 | Tragic $36,673 |
| Africans | 0.1 /100 | #275 | Tragic $36,530 |
| Central Americans | 0.1 /100 | #276 | Tragic $36,492 |
| Marshallese | 0.1 /100 | #277 | Tragic $36,459 |