Iranian vs Immigrants from Peru Median Female Earnings
COMPARE
Iranian
Immigrants from Peru
Median Female Earnings
Median Female Earnings Comparison
Iranians
Immigrants from Peru
$47,421
MEDIAN FEMALE EARNINGS
100.0/ 100
METRIC RATING
8th/ 347
METRIC RANK
$39,871
MEDIAN FEMALE EARNINGS
58.9/ 100
METRIC RATING
168th/ 347
METRIC RANK
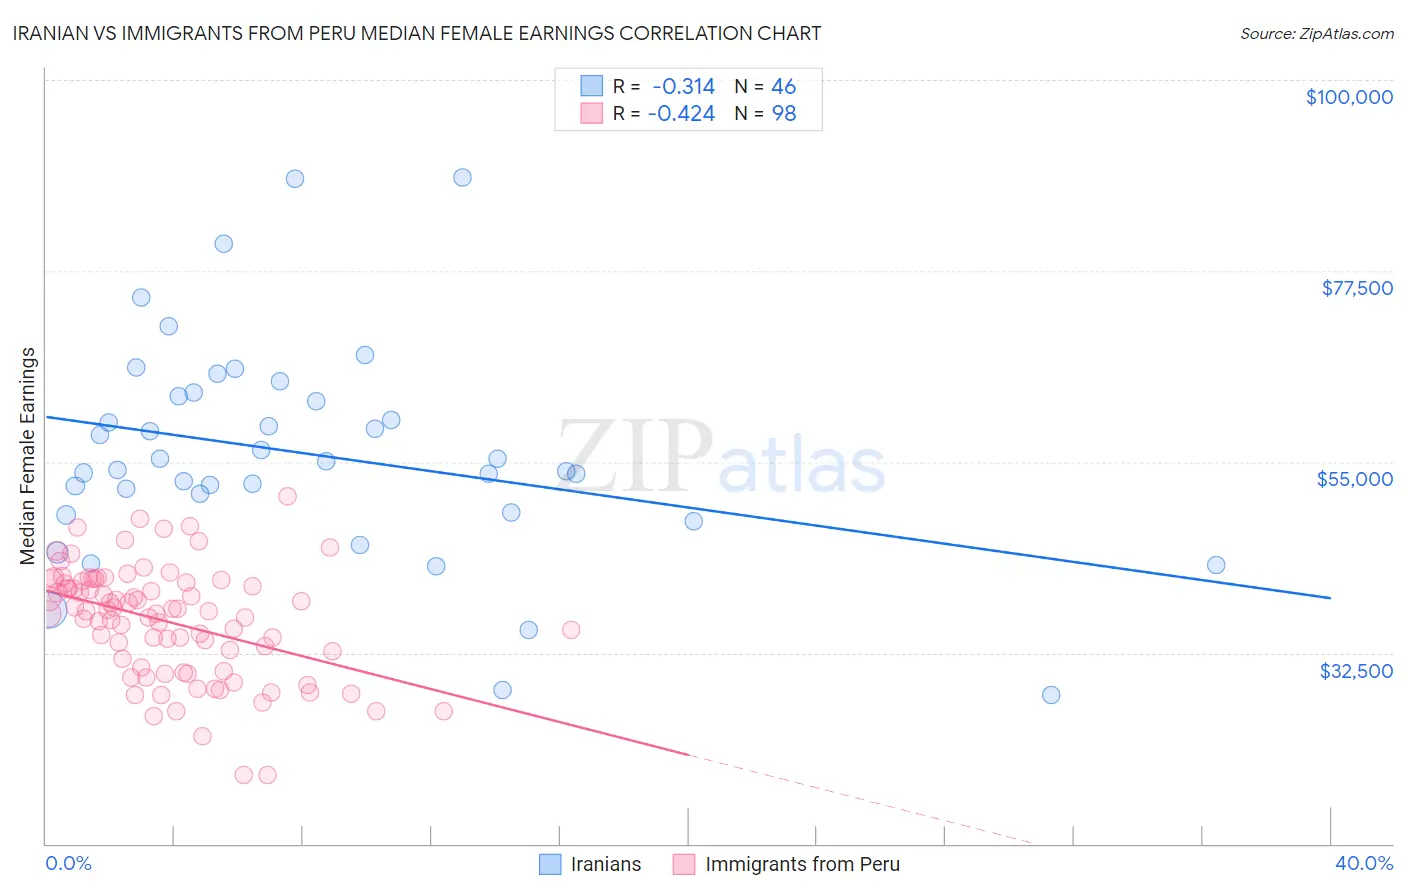
Iranian vs Immigrants from Peru Median Female Earnings Correlation Chart
The statistical analysis conducted on geographies consisting of 316,781,668 people shows a mild negative correlation between the proportion of Iranians and median female earnings in the United States with a correlation coefficient (R) of -0.314 and weighted average of $47,421. Similarly, the statistical analysis conducted on geographies consisting of 328,788,415 people shows a moderate negative correlation between the proportion of Immigrants from Peru and median female earnings in the United States with a correlation coefficient (R) of -0.424 and weighted average of $39,871, a difference of 18.9%.
Median Female Earnings Correlation Summary
| Measurement | Iranian | Immigrants from Peru |
| Minimum | $27,465 | $18,150 |
| Maximum | $88,523 | $50,975 |
| Range | $61,058 | $32,825 |
| Mean | $55,900 | $36,171 |
| Median | $54,566 | $37,366 |
| Interquartile 25% (IQ1) | $49,107 | $30,816 |
| Interquartile 75% (IQ3) | $62,773 | $40,742 |
| Interquartile Range (IQR) | $13,666 | $9,926 |
| Standard Deviation (Sample) | $12,815 | $6,551 |
| Standard Deviation (Population) | $12,675 | $6,517 |
Similar Demographics by Median Female Earnings
Demographics Similar to Iranians by Median Female Earnings
In terms of median female earnings, the demographic groups most similar to Iranians are Thai ($47,577, a difference of 0.33%), Immigrants from Ireland ($47,598, a difference of 0.37%), Immigrants from Iran ($47,154, a difference of 0.57%), Immigrants from China ($46,972, a difference of 0.95%), and Okinawan ($46,905, a difference of 1.1%).
| Demographics | Rating | Rank | Median Female Earnings |
| Immigrants | Hong Kong | 100.0 /100 | #1 | Exceptional $49,818 |
| Filipinos | 100.0 /100 | #2 | Exceptional $49,508 |
| Immigrants | Taiwan | 100.0 /100 | #3 | Exceptional $49,256 |
| Immigrants | India | 100.0 /100 | #4 | Exceptional $48,292 |
| Immigrants | Singapore | 100.0 /100 | #5 | Exceptional $47,986 |
| Immigrants | Ireland | 100.0 /100 | #6 | Exceptional $47,598 |
| Thais | 100.0 /100 | #7 | Exceptional $47,577 |
| Iranians | 100.0 /100 | #8 | Exceptional $47,421 |
| Immigrants | Iran | 100.0 /100 | #9 | Exceptional $47,154 |
| Immigrants | China | 100.0 /100 | #10 | Exceptional $46,972 |
| Okinawans | 100.0 /100 | #11 | Exceptional $46,905 |
| Immigrants | Israel | 100.0 /100 | #12 | Exceptional $46,902 |
| Immigrants | Australia | 100.0 /100 | #13 | Exceptional $46,573 |
| Soviet Union | 100.0 /100 | #14 | Exceptional $46,556 |
| Immigrants | Eastern Asia | 100.0 /100 | #15 | Exceptional $46,502 |
Demographics Similar to Immigrants from Peru by Median Female Earnings
In terms of median female earnings, the demographic groups most similar to Immigrants from Peru are Kenyan ($39,860, a difference of 0.030%), Luxembourger ($39,891, a difference of 0.050%), Immigrants from Ghana ($39,894, a difference of 0.060%), Immigrants from Bangladesh ($39,910, a difference of 0.10%), and Slovene ($39,817, a difference of 0.13%).
| Demographics | Rating | Rank | Median Female Earnings |
| Alsatians | 68.0 /100 | #161 | Good $40,060 |
| South American Indians | 66.1 /100 | #162 | Good $40,019 |
| Lebanese | 65.5 /100 | #163 | Good $40,006 |
| Immigrants | Saudi Arabia | 62.9 /100 | #164 | Good $39,952 |
| Immigrants | Bangladesh | 60.8 /100 | #165 | Good $39,910 |
| Immigrants | Ghana | 60.0 /100 | #166 | Good $39,894 |
| Luxembourgers | 59.9 /100 | #167 | Average $39,891 |
| Immigrants | Peru | 58.9 /100 | #168 | Average $39,871 |
| Kenyans | 58.4 /100 | #169 | Average $39,860 |
| Slovenes | 56.2 /100 | #170 | Average $39,817 |
| Immigrants | Portugal | 54.7 /100 | #171 | Average $39,788 |
| British | 53.8 /100 | #172 | Average $39,772 |
| Canadians | 51.4 /100 | #173 | Average $39,724 |
| South Americans | 50.0 /100 | #174 | Average $39,698 |
| Immigrants | South America | 47.2 /100 | #175 | Average $39,643 |