Inupiat vs Immigrants from Syria Median Female Earnings
COMPARE
Inupiat
Immigrants from Syria
Median Female Earnings
Median Female Earnings Comparison
Inupiat
Immigrants from Syria
$40,080
MEDIAN FEMALE EARNINGS
68.9/ 100
METRIC RATING
160th/ 347
METRIC RANK
$40,499
MEDIAN FEMALE EARNINGS
84.1/ 100
METRIC RATING
141st/ 347
METRIC RANK
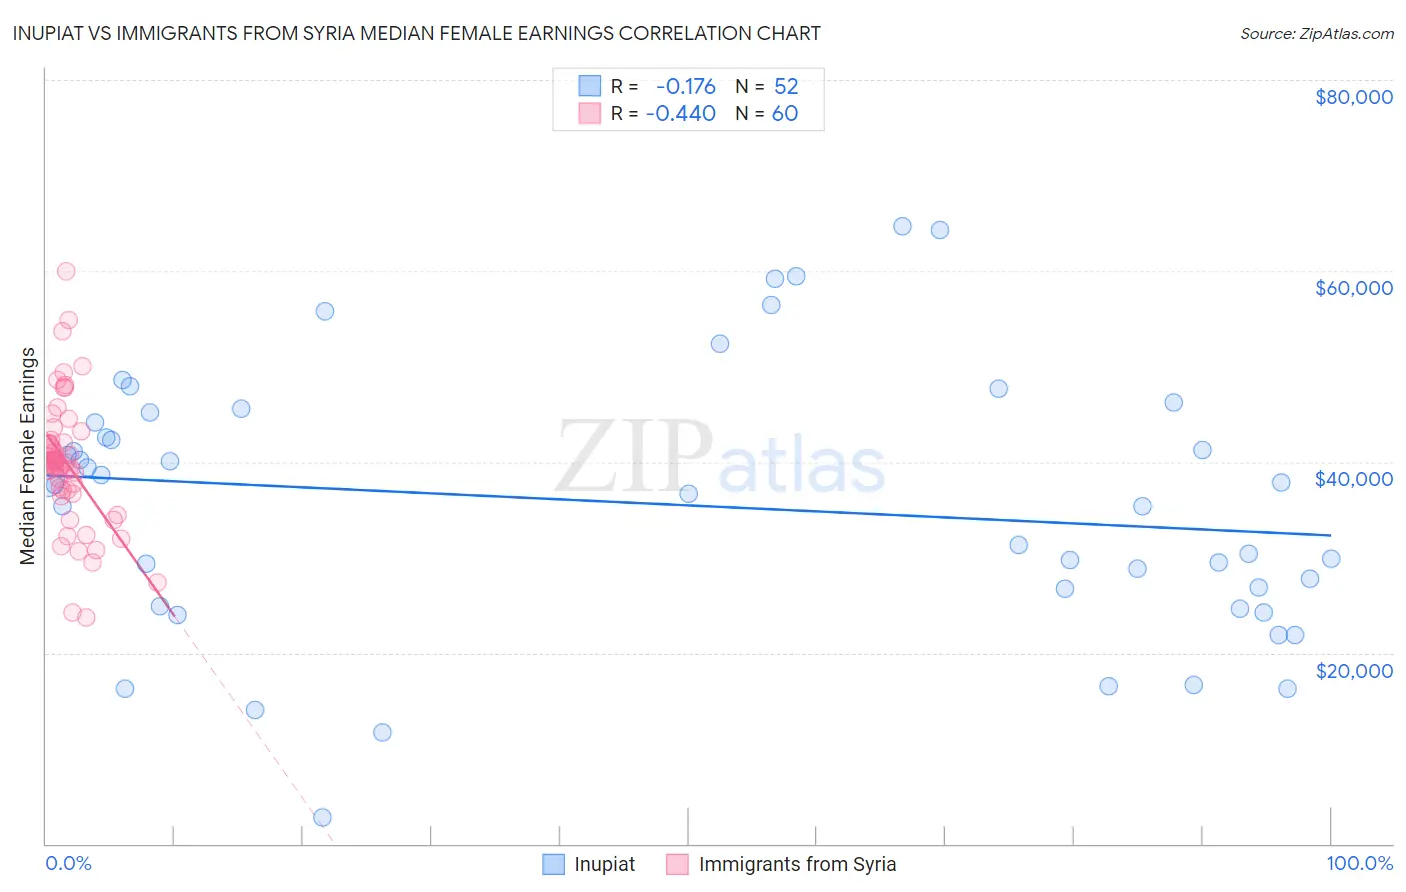
Inupiat vs Immigrants from Syria Median Female Earnings Correlation Chart
The statistical analysis conducted on geographies consisting of 96,311,190 people shows a poor negative correlation between the proportion of Inupiat and median female earnings in the United States with a correlation coefficient (R) of -0.176 and weighted average of $40,080. Similarly, the statistical analysis conducted on geographies consisting of 174,108,598 people shows a moderate negative correlation between the proportion of Immigrants from Syria and median female earnings in the United States with a correlation coefficient (R) of -0.440 and weighted average of $40,499, a difference of 1.1%.
Median Female Earnings Correlation Summary
| Measurement | Inupiat | Immigrants from Syria |
| Minimum | $2,800 | $23,750 |
| Maximum | $64,688 | $60,000 |
| Range | $61,888 | $36,250 |
| Mean | $35,589 | $39,767 |
| Median | $37,155 | $39,904 |
| Interquartile 25% (IQ1) | $25,800 | $36,881 |
| Interquartile 75% (IQ3) | $44,695 | $42,187 |
| Interquartile Range (IQR) | $18,895 | $5,305 |
| Standard Deviation (Sample) | $13,962 | $6,836 |
| Standard Deviation (Population) | $13,827 | $6,779 |
Demographics Similar to Inupiat and Immigrants from Syria by Median Female Earnings
In terms of median female earnings, the demographic groups most similar to Inupiat are Immigrants from Vietnam ($40,153, a difference of 0.18%), Immigrants from Senegal ($40,157, a difference of 0.19%), Portuguese ($40,177, a difference of 0.24%), Peruvian ($40,234, a difference of 0.38%), and Immigrants from Africa ($40,257, a difference of 0.44%). Similarly, the demographic groups most similar to Immigrants from Syria are Sri Lankan ($40,496, a difference of 0.010%), Northern European ($40,491, a difference of 0.020%), Immigrants from North Macedonia ($40,488, a difference of 0.030%), Brazilian ($40,483, a difference of 0.040%), and Serbian ($40,539, a difference of 0.10%).
| Demographics | Rating | Rank | Median Female Earnings |
| Serbians | 85.2 /100 | #140 | Excellent $40,539 |
| Immigrants | Syria | 84.1 /100 | #141 | Excellent $40,499 |
| Sri Lankans | 84.0 /100 | #142 | Excellent $40,496 |
| Northern Europeans | 83.9 /100 | #143 | Excellent $40,491 |
| Immigrants | North Macedonia | 83.8 /100 | #144 | Excellent $40,488 |
| Brazilians | 83.6 /100 | #145 | Excellent $40,483 |
| Ghanaians | 82.1 /100 | #146 | Excellent $40,429 |
| Vietnamese | 80.4 /100 | #147 | Excellent $40,377 |
| Poles | 80.2 /100 | #148 | Excellent $40,371 |
| Immigrants | Cameroon | 79.7 /100 | #149 | Good $40,354 |
| Immigrants | Chile | 79.6 /100 | #150 | Good $40,353 |
| Immigrants | Armenia | 79.2 /100 | #151 | Good $40,340 |
| West Indians | 78.4 /100 | #152 | Good $40,317 |
| British West Indians | 77.7 /100 | #153 | Good $40,299 |
| Immigrants | Oceania | 77.6 /100 | #154 | Good $40,297 |
| Immigrants | Africa | 76.2 /100 | #155 | Good $40,257 |
| Peruvians | 75.3 /100 | #156 | Good $40,234 |
| Portuguese | 73.0 /100 | #157 | Good $40,177 |
| Immigrants | Senegal | 72.2 /100 | #158 | Good $40,157 |
| Immigrants | Vietnam | 72.0 /100 | #159 | Good $40,153 |
| Inupiat | 68.9 /100 | #160 | Good $40,080 |