Immigrants vs Immigrants from Scotland Median Earnings
COMPARE
Immigrants
Immigrants from Scotland
Median Earnings
Median Earnings Comparison
Immigrants
Immigrants from Scotland
$46,478
MEDIAN EARNINGS
51.6/ 100
METRIC RATING
170th/ 347
METRIC RANK
$50,741
MEDIAN EARNINGS
99.8/ 100
METRIC RATING
75th/ 347
METRIC RANK
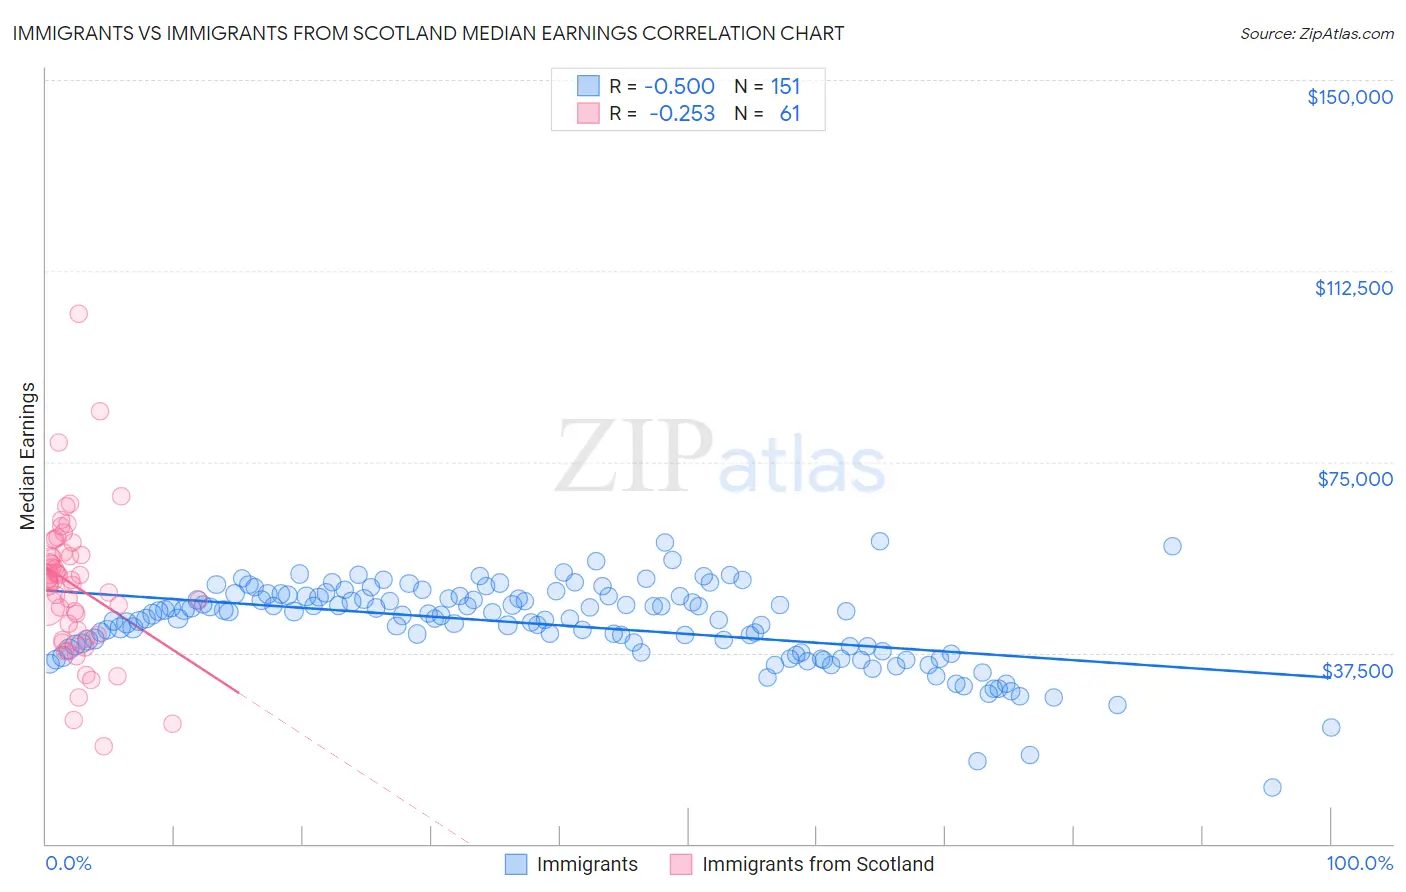
Immigrants vs Immigrants from Scotland Median Earnings Correlation Chart
The statistical analysis conducted on geographies consisting of 576,851,611 people shows a substantial negative correlation between the proportion of Immigrants and median earnings in the United States with a correlation coefficient (R) of -0.500 and weighted average of $46,478. Similarly, the statistical analysis conducted on geographies consisting of 196,389,390 people shows a weak negative correlation between the proportion of Immigrants from Scotland and median earnings in the United States with a correlation coefficient (R) of -0.253 and weighted average of $50,741, a difference of 9.2%.
Median Earnings Correlation Summary
| Measurement | Immigrants | Immigrants from Scotland |
| Minimum | $10,941 | $19,118 |
| Maximum | $59,517 | $104,015 |
| Range | $48,576 | $84,897 |
| Mean | $43,122 | $50,819 |
| Median | $44,875 | $51,683 |
| Interquartile 25% (IQ1) | $37,857 | $41,420 |
| Interquartile 75% (IQ3) | $48,614 | $56,954 |
| Interquartile Range (IQR) | $10,757 | $15,534 |
| Standard Deviation (Sample) | $8,036 | $14,157 |
| Standard Deviation (Population) | $8,009 | $14,040 |
Similar Demographics by Median Earnings
Demographics Similar to Immigrants by Median Earnings
In terms of median earnings, the demographic groups most similar to Immigrants are Scottish ($46,463, a difference of 0.030%), Kenyan ($46,462, a difference of 0.030%), Ghanaian ($46,440, a difference of 0.080%), Scandinavian ($46,433, a difference of 0.10%), and Immigrants from South America ($46,548, a difference of 0.15%).
| Demographics | Rating | Rank | Median Earnings |
| Icelanders | 66.3 /100 | #163 | Good $46,916 |
| Norwegians | 64.7 /100 | #164 | Good $46,865 |
| South Americans | 62.7 /100 | #165 | Good $46,804 |
| Czechoslovakians | 57.8 /100 | #166 | Average $46,658 |
| Costa Ricans | 57.4 /100 | #167 | Average $46,645 |
| Immigrants | Africa | 54.6 /100 | #168 | Average $46,564 |
| Immigrants | South America | 54.0 /100 | #169 | Average $46,548 |
| Immigrants | Immigrants | 51.6 /100 | #170 | Average $46,478 |
| Scottish | 51.1 /100 | #171 | Average $46,463 |
| Kenyans | 51.0 /100 | #172 | Average $46,462 |
| Ghanaians | 50.3 /100 | #173 | Average $46,440 |
| Scandinavians | 50.0 /100 | #174 | Average $46,433 |
| Basques | 48.8 /100 | #175 | Average $46,399 |
| Danes | 48.6 /100 | #176 | Average $46,392 |
| Belgians | 48.0 /100 | #177 | Average $46,375 |
Demographics Similar to Immigrants from Scotland by Median Earnings
In terms of median earnings, the demographic groups most similar to Immigrants from Scotland are South African ($50,752, a difference of 0.020%), Immigrants from Netherlands ($50,818, a difference of 0.15%), Immigrants from Egypt ($50,901, a difference of 0.32%), Immigrants from Italy ($50,581, a difference of 0.32%), and Immigrants from Western Europe ($50,549, a difference of 0.38%).
| Demographics | Rating | Rank | Median Earnings |
| Paraguayans | 99.9 /100 | #68 | Exceptional $51,068 |
| Mongolians | 99.8 /100 | #69 | Exceptional $51,038 |
| Lithuanians | 99.8 /100 | #70 | Exceptional $50,991 |
| Immigrants | Ukraine | 99.8 /100 | #71 | Exceptional $50,984 |
| Immigrants | Egypt | 99.8 /100 | #72 | Exceptional $50,901 |
| Immigrants | Netherlands | 99.8 /100 | #73 | Exceptional $50,818 |
| South Africans | 99.8 /100 | #74 | Exceptional $50,752 |
| Immigrants | Scotland | 99.8 /100 | #75 | Exceptional $50,741 |
| Immigrants | Italy | 99.7 /100 | #76 | Exceptional $50,581 |
| Immigrants | Western Europe | 99.7 /100 | #77 | Exceptional $50,549 |
| Argentineans | 99.6 /100 | #78 | Exceptional $50,399 |
| Laotians | 99.6 /100 | #79 | Exceptional $50,343 |
| Ukrainians | 99.6 /100 | #80 | Exceptional $50,320 |
| Immigrants | Southern Europe | 99.6 /100 | #81 | Exceptional $50,280 |
| Immigrants | Moldova | 99.5 /100 | #82 | Exceptional $50,274 |