Immigrants vs Immigrants from Sweden Median Earnings
COMPARE
Immigrants
Immigrants from Sweden
Median Earnings
Median Earnings Comparison
Immigrants
Immigrants from Sweden
$46,478
MEDIAN EARNINGS
51.6/ 100
METRIC RATING
170th/ 347
METRIC RANK
$54,478
MEDIAN EARNINGS
100.0/ 100
METRIC RATING
23rd/ 347
METRIC RANK
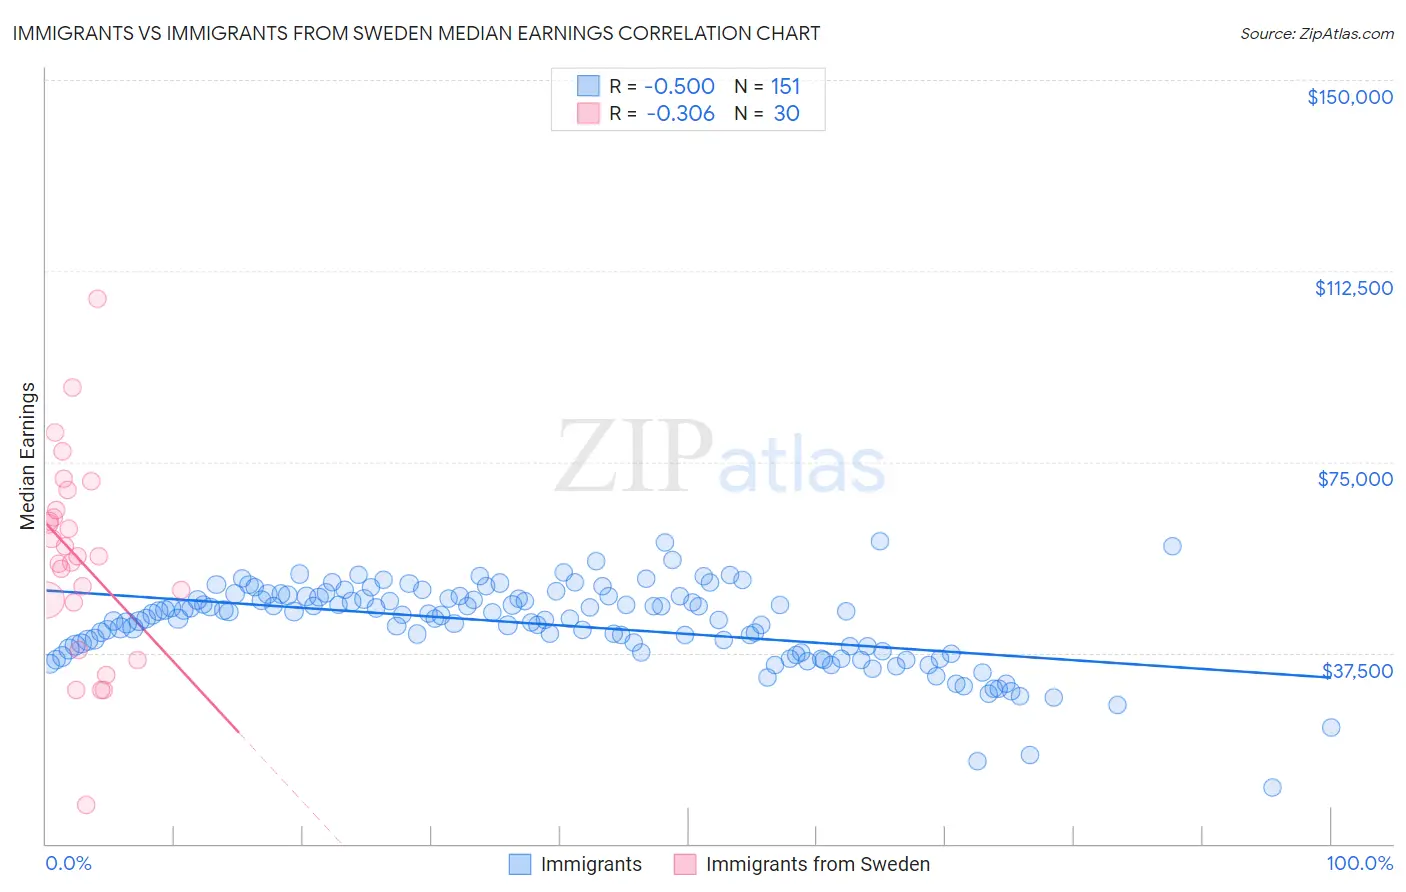
Immigrants vs Immigrants from Sweden Median Earnings Correlation Chart
The statistical analysis conducted on geographies consisting of 576,851,611 people shows a substantial negative correlation between the proportion of Immigrants and median earnings in the United States with a correlation coefficient (R) of -0.500 and weighted average of $46,478. Similarly, the statistical analysis conducted on geographies consisting of 164,745,494 people shows a mild negative correlation between the proportion of Immigrants from Sweden and median earnings in the United States with a correlation coefficient (R) of -0.306 and weighted average of $54,478, a difference of 17.2%.
Median Earnings Correlation Summary
| Measurement | Immigrants | Immigrants from Sweden |
| Minimum | $10,941 | $7,643 |
| Maximum | $59,517 | $106,979 |
| Range | $48,576 | $99,336 |
| Mean | $43,122 | $56,044 |
| Median | $44,875 | $56,394 |
| Interquartile 25% (IQ1) | $37,857 | $47,341 |
| Interquartile 75% (IQ3) | $48,614 | $65,578 |
| Interquartile Range (IQR) | $10,757 | $18,237 |
| Standard Deviation (Sample) | $8,036 | $19,951 |
| Standard Deviation (Population) | $8,009 | $19,616 |
Similar Demographics by Median Earnings
Demographics Similar to Immigrants by Median Earnings
In terms of median earnings, the demographic groups most similar to Immigrants are Scottish ($46,463, a difference of 0.030%), Kenyan ($46,462, a difference of 0.030%), Ghanaian ($46,440, a difference of 0.080%), Scandinavian ($46,433, a difference of 0.10%), and Immigrants from South America ($46,548, a difference of 0.15%).
| Demographics | Rating | Rank | Median Earnings |
| Icelanders | 66.3 /100 | #163 | Good $46,916 |
| Norwegians | 64.7 /100 | #164 | Good $46,865 |
| South Americans | 62.7 /100 | #165 | Good $46,804 |
| Czechoslovakians | 57.8 /100 | #166 | Average $46,658 |
| Costa Ricans | 57.4 /100 | #167 | Average $46,645 |
| Immigrants | Africa | 54.6 /100 | #168 | Average $46,564 |
| Immigrants | South America | 54.0 /100 | #169 | Average $46,548 |
| Immigrants | Immigrants | 51.6 /100 | #170 | Average $46,478 |
| Scottish | 51.1 /100 | #171 | Average $46,463 |
| Kenyans | 51.0 /100 | #172 | Average $46,462 |
| Ghanaians | 50.3 /100 | #173 | Average $46,440 |
| Scandinavians | 50.0 /100 | #174 | Average $46,433 |
| Basques | 48.8 /100 | #175 | Average $46,399 |
| Danes | 48.6 /100 | #176 | Average $46,392 |
| Belgians | 48.0 /100 | #177 | Average $46,375 |
Demographics Similar to Immigrants from Sweden by Median Earnings
In terms of median earnings, the demographic groups most similar to Immigrants from Sweden are Immigrants from Korea ($54,530, a difference of 0.10%), Burmese ($54,559, a difference of 0.15%), Cypriot ($54,589, a difference of 0.20%), Soviet Union ($54,290, a difference of 0.35%), and Immigrants from Belgium ($54,679, a difference of 0.37%).
| Demographics | Rating | Rank | Median Earnings |
| Immigrants | Eastern Asia | 100.0 /100 | #16 | Exceptional $56,183 |
| Eastern Europeans | 100.0 /100 | #17 | Exceptional $55,084 |
| Immigrants | Japan | 100.0 /100 | #18 | Exceptional $54,938 |
| Immigrants | Belgium | 100.0 /100 | #19 | Exceptional $54,679 |
| Cypriots | 100.0 /100 | #20 | Exceptional $54,589 |
| Burmese | 100.0 /100 | #21 | Exceptional $54,559 |
| Immigrants | Korea | 100.0 /100 | #22 | Exceptional $54,530 |
| Immigrants | Sweden | 100.0 /100 | #23 | Exceptional $54,478 |
| Soviet Union | 100.0 /100 | #24 | Exceptional $54,290 |
| Turks | 100.0 /100 | #25 | Exceptional $53,919 |
| Immigrants | Northern Europe | 100.0 /100 | #26 | Exceptional $53,872 |
| Asians | 100.0 /100 | #27 | Exceptional $53,690 |
| Immigrants | France | 100.0 /100 | #28 | Exceptional $53,490 |
| Immigrants | Russia | 100.0 /100 | #29 | Exceptional $53,457 |
| Cambodians | 100.0 /100 | #30 | Exceptional $53,386 |